 Global| Nov 16 2006
Industrial Output Ticked Higher, Trend Slowdown Dramatic
by:Tom Moeller
|in:Economy in Brief
Summary
Total U.S. industrial production ticked higher 0.2% during October following the prior month's unrevised 0.6% decline. The increase just missed Consensus expectations for a 0.3% rise.The recent weakness has left output unchanged [...]
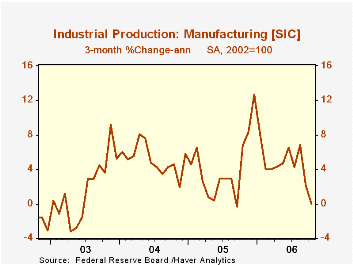
Total U.S. industrial production ticked higher 0.2% during October following the prior month's unrevised 0.6% decline. The increase just missed Consensus expectations for a 0.3% rise.The recent weakness has left output unchanged during the last three months and compares to 5-8% annual rates of growth earlier this year.
Last month's output increase was all due to a 4.1% (2.8% y/y) jump in utility output due to unseasonably cool temperatures.
Factory sector output fell 0.3% for the second consecutive month. The unchanged level of factory production during the last three months compares to a 7.9% annualized rate of growth just this past August.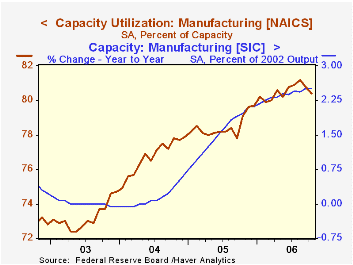
Production of durable consumer goods fell 2.6% (-6.8% y/y) due to a 4.6% decline (-11.4% y/y) in the output of automotive products. Output of appliances & furniture also fell 0.8% (-5.4% y/y) for the seventh monthly decline this year. Nondurable consumer goods output increased 0.3% (2.6% y/y) helped by a 1.4% (4.7% y/y) surge in clothing output which recovered the decline of the prior month.
Business equipment production recovered from the modest September decline with a 0.7% increase. Output of information processing & equipment surged 1.3% (15.6% y/y) but factory output overall less the hi-tech industries fell 0.5% (+2.7% y/y) for the second consecutive month. Output of transit equipment rose 0.5% (16.9% y/y).
Overall capacity utilization increased slightly to 82.2%. Factory sector utilization, however, fell to 80.4%. Factory sector capacity again rose a firm 0.2% (2.5% y/y).
The U.S. Current Account Deficit and the Expected Share of World Output from the Federal Reserve Bank of San Francisco is available here.
The Conquest of Worldwide Inflation: Currency Competition and Its Implications for Interest Rates and the Yield Curve is today's speech by Fed Governor Randall S. Kroszner and can be found here.
| Production & Capacity | October | September | Y/Y | 2005 | 2004 | 2003 |
|---|---|---|---|---|---|---|
| Industrial Production | 0.2% | -0.6% | 4.9% | 3.2% | 4.1% | 0.6% |
| Manufacturing (NAICS) | -0.3% | -0.3% | 4.4% | 3.9% | 4.8% | 0.5% |
| Consumer Goods | -0.5% | -0.9% | -0.1% | 2.1% | 2.1% | 1.0% |
| Business Equipment | 0.7% | -0.1% | 11.7% | 9.1% | 9.3% | 0.0% |
| Capacity Utilization | 82.2% | 82.1% | 79.9% (10/05) | 80.1% | 78.6% | 75.7% |

Tom Moeller
AuthorMore in Author Profile »Prior to joining Haver Analytics in 2000, Mr. Moeller worked as the Economist at Chancellor Capital Management from 1985 to 1999. There, he developed comprehensive economic forecasts and interpreted economic data for equity and fixed income portfolio managers. Also at Chancellor, Mr. Moeller worked as an equity analyst and was responsible for researching and rating companies in the economically sensitive automobile and housing industries for investment in Chancellor’s equity portfolio. Prior to joining Chancellor, Mr. Moeller was an Economist at Citibank from 1979 to 1984. He also analyzed pricing behavior in the metals industry for the Council on Wage and Price Stability in Washington, D.C. In 1999, Mr. Moeller received the award for most accurate forecast from the Forecasters' Club of New York. From 1990 to 1992 he was President of the New York Association for Business Economists. Mr. Moeller earned an M.B.A. in Finance from Fordham University, where he graduated in 1987. He holds a Bachelor of Arts in Economics from George Washington University.
More Economy in Brief


