 Global| Jan 15 2010
Industrial Output In December Is Lifted By Utilities
by:Tom Moeller
|in:Economy in Brief
Summary
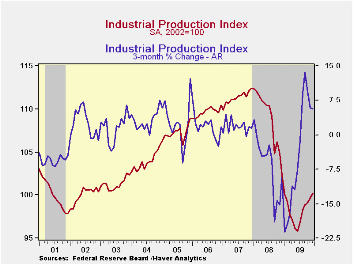
For the U.S. factory sector, 2009 was rough but activity improved as the year went on. For the year as a whole industrial production fell 9.7% following a lesser 2008 decline. In June, however, the decline in activity troughed and [...]
 For the U.S.
factory sector, 2009 was rough but activity improved as the year went
on. For the year as a whole industrial production fell 9.7% following a
lesser 2008 decline. In June, however, the decline in activity troughed
and since then is up 4.7% helped by an expected 0.6% December increase.
Though the latest gain was all due to a rise in utility output with
arrival of a winter cold snap, factory sector output alone is up 4.6%
from its trough.
For the U.S.
factory sector, 2009 was rough but activity improved as the year went
on. For the year as a whole industrial production fell 9.7% following a
lesser 2008 decline. In June, however, the decline in activity troughed
and since then is up 4.7% helped by an expected 0.6% December increase.
Though the latest gain was all due to a rise in utility output with
arrival of a winter cold snap, factory sector output alone is up 4.6%
from its trough.
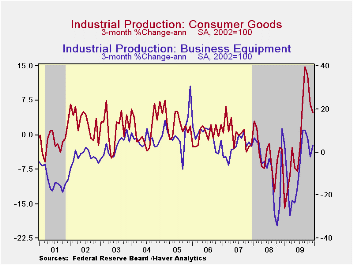
Output of consumer goods rose 0.6% during December. Production here is up 4.8% from its trough due to a one-third rise in auto products output and a 4.4% gain in clothing. Computers, video & audio output lagged with a 2.2% rate of increase during the last six months while output of appliances, furniture & carpeting slipped 0.1%. The latter figure, however, shows some stabilization after an 18.0% full year decline. Business equipment output rose 0.9% last month (-9.6% y/y) and reversed the November decline. Moreover, since the June bottom activity has risen 3.2%.
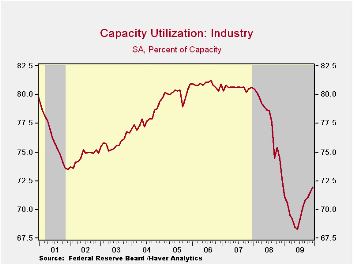
Capacity utilization rose further to 72.0%, its highest level since December 2008 but for the year as a whole the utilization rate dropped to 70.2%. In the factory sector alone utilization held steady m/m at 68.8% but dropped to 67.0% for the year from 75.0% in 2008. Utilization in the primary metals area has risen sharply to 58.9% from a 2009 average of 51.0% with the rebound in output. There's also been rise in utilization in the motor vehicle sector to 52.2% from a low of 36.8% in June but it was 77.0% in 2005. In rise in utilization was accompanied by a 0.1% m/m decline in capacity which was part of a 1.0% December-to-December decline.
The industrial production data are available in Haver's USECON database.
Is the Great Moderation Over? An Empirical Analysis from the Federal Reserve Bank of Kansas City is available here.
| Industrial Production (SA,%) | December | November | October | Y/Y | 2009 | 2008 | 2007 |
|---|---|---|---|---|---|---|---|
| Total Output | 0.6 | 0.6 | 0.2 | -2.1 | -9.7 | -2.2 | 1.5 |
| Manufacturing | 0.0 | 0.9 | -0.2 | -1.9 | -11.2 | -3.2 | 1.4 |
| Consumer Goods | 0.6 | 0.0 | 0.6 | 0.3 | -5.1 | -2.6 | 0.9 |
| Business Equipment | 0.9 | -0.7 | 0.6 | -9.6 | -12.6 | -1.1 | 2.7 |
| Construction Supplies | -2.0 | 1.5 | -1.6 | -10.1 | -17.7 | -6.3 | -2.0 |
| Materials | 0.8 | 1.2 | 0.1 | -0.2 | -10.8 | -1.9 | 2.0 |
| Utilities | 6.0 | -2.4 | 2.6 | -0.8 | -2.6 | 0.3 | 3.4 |
| Capacity Utilization (%) | 72.0 | 71.5 | 71.0 | 72.7 (Dec. '08) | 77.5 | 80.6 |

Tom Moeller
AuthorMore in Author Profile »Prior to joining Haver Analytics in 2000, Mr. Moeller worked as the Economist at Chancellor Capital Management from 1985 to 1999. There, he developed comprehensive economic forecasts and interpreted economic data for equity and fixed income portfolio managers. Also at Chancellor, Mr. Moeller worked as an equity analyst and was responsible for researching and rating companies in the economically sensitive automobile and housing industries for investment in Chancellor’s equity portfolio. Prior to joining Chancellor, Mr. Moeller was an Economist at Citibank from 1979 to 1984. He also analyzed pricing behavior in the metals industry for the Council on Wage and Price Stability in Washington, D.C. In 1999, Mr. Moeller received the award for most accurate forecast from the Forecasters' Club of New York. From 1990 to 1992 he was President of the New York Association for Business Economists. Mr. Moeller earned an M.B.A. in Finance from Fordham University, where he graduated in 1987. He holds a Bachelor of Arts in Economics from George Washington University.
More Economy in Brief


