 Global| Sep 09 2005
Import Prices Jumped
by:Tom Moeller
|in:Economy in Brief
Summary
Import prices last month about matched Consensus expectations and jumped 1.3%, although July's gain was revised lower to 0.8% from 1.1% reported initially. Petroleum prices surged another 7.1% on top of a downwardly revised 6.1% spike [...]
Import prices last month about matched Consensus expectations and jumped 1.3%, although July's gain was revised lower to 0.8% from 1.1% reported initially.
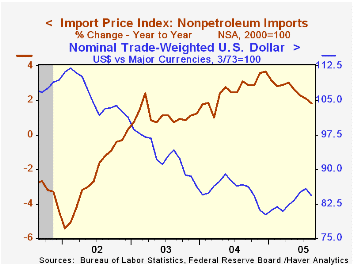
Petroleum prices surged another 7.1% on top of a downwardly revised 6.1% spike in July. So far in September, Brent crude oil prices have averaged $65.00 and yesterday traded at $63.79/bbl. versus an average $64.10 in August.
Import prices other than petroleum were unchanged following three consecutive months of 0.2% decline. The July decline was revised deeper from 0.1%. Prices for nonauto consumer goods fell 0.2% (+1.1% y/y) for the second month and capital goods prices were unchanged (-0.4% y/y). Computer, peripheral & semiconductor prices rose 0.1% (-6.0% y/y). Excluding computers capital goods prices fell 0.1% (2.2% y/y) for the second consecutive month.
During the last ten years there has been a 66% (negative) correlation between the nominal trade-weighted exchange value of the US dollar vs. major currencies and the y/y change in non oil import prices. The correlation is a lower 47% against a broader basket of currencies and a lower 57% against the real value of the dollar.
Export prices slipped 0.1% as agricultural prices fell 0.6% (+6.6% y/y) and nonagricultural prices fell 0.1% (+2.7% y/y).
U.S. Jobs Gained and Lost through Trade: A Net Measure from the Federal Reserve Bank of New York is available here.
The Beige Book covering U.S. regional economic conditions from the Federal Reserve Board can be found here.
| Import/Export Prices (NSA) | Aug | July | Y/Y | 2004 | 2003 | 2002 |
|---|---|---|---|---|---|---|
| Import - All Commodities | 1.3% | 0.8% | 7.6% | 5.6% | 2.9% | -2.5% |
| Petroleum | 7.1% | 6.1% | 42.5% | 30.5% | 21.0% | 3.0% |
| Non-petroleum | 0.0% | -0.2% | 1.8% | 2.6% | 1.1% | -2.4% |
| Export - All Commodities | -0.1% | 0.1% | 3.1% | 3.9% | 1.6% | -1.0% |
by Carol Stone September 9, 2005
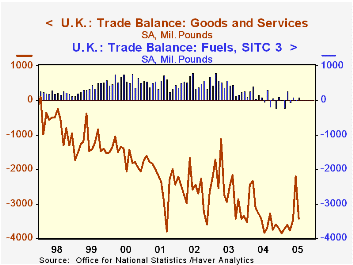
The trade deficit in the UK widened anew in July, according to data reported today by the Office of National Statistics (ONS). After a jump in exports lowered the June deficit to -£2.21 billion, the July deficit was -£3.43 billion, almost the same as in May. Exports were up 5.5% in June, then dropped back by 3.9% in July. Imports rose 0.5% in each month, almost completely accounted for by fuel imports.
The June gain in exports was in most kinds of goods and services and was mirrored by similar-sized reductions in July. This swing took place in trade with non-EU countries, especially the US, Japan and non-OECD countries. Exports to the EU-25 nations have been fairly stable for the last several months. 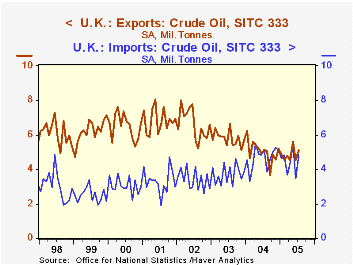
We also note a modest deterioration in the UK's trade balance in fuel. This is not recent, but occurred during 2004 when there was a marked rise in fuel imports. The value of fuel exports has also risen, but due only to the uptrend in prices. The volume of exports is decreasing, while that of imports rose markedly going into this year and has oscillated widely during 2005. The impact on import values is greater because import prices for fuel have been rising noticeably faster than export prices. Two-way trade in crude oil (the SUM of exports and imports of crude), measured in tonnes, has been largely constant at 9.5-10 million tonnes since at least 2002, despite the large changes in prices.
| UK Trade, SA, Bil.£ | July 2005 | June 2005 | May 2005 | July 2004 | Monthly Averages|||
|---|---|---|---|---|---|---|---|
| 2004 | 2003 | 2002 | |||||
| Trade Balance: Goods & Services | -3.43 | -2.21 | -3.48 | -3.85 | -3.34 | -2.58 | -2.63 |
| Exports | 25.93 | 27.00 | 25.59 | 24.10 | 24.17 | 23.52 | 22.91 |
| Imports | 29.36 | 29.20 | 29.06 | 27.95 | 27.51 | 26.10 | 25.54 |
| Fuels | 0.09 | 0.01 | 0.01 | -0.03 | 0.10 | 0.42 | 0.53 |
| Exports | 2.08 | 1.85 | 1.84 | 1.51 | 1.50 | 1.38 | 1.33 |
| Imports | 1.99 | 1.84 | 1.74 | 1.53 | 1.40 | 0.96 | 0.80 |

Tom Moeller
AuthorMore in Author Profile »Prior to joining Haver Analytics in 2000, Mr. Moeller worked as the Economist at Chancellor Capital Management from 1985 to 1999. There, he developed comprehensive economic forecasts and interpreted economic data for equity and fixed income portfolio managers. Also at Chancellor, Mr. Moeller worked as an equity analyst and was responsible for researching and rating companies in the economically sensitive automobile and housing industries for investment in Chancellor’s equity portfolio. Prior to joining Chancellor, Mr. Moeller was an Economist at Citibank from 1979 to 1984. He also analyzed pricing behavior in the metals industry for the Council on Wage and Price Stability in Washington, D.C. In 1999, Mr. Moeller received the award for most accurate forecast from the Forecasters' Club of New York. From 1990 to 1992 he was President of the New York Association for Business Economists. Mr. Moeller earned an M.B.A. in Finance from Fordham University, where he graduated in 1987. He holds a Bachelor of Arts in Economics from George Washington University.
More Economy in Brief


