 Global| May 26 2009
IFO Shows Sector Indices HaveBottomed...Maybe
Summary
IFO improves, barely -- The IFO survey is in the same boat as the rest of the recent economic indicators. The index is off its low, and rising but still showing contraction. The improvement in May continued but was very slight for [...]
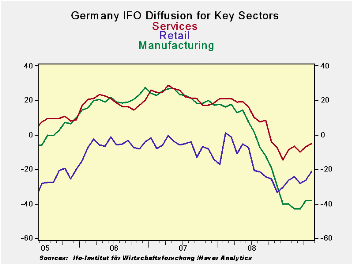 IFO improves, barely
-- The
IFO survey is in the same boat as the rest of the recent economic
indicators. The index is off its low, and rising but still showing
contraction. The improvement in May continued but was very slight for
most sectors. Manufacturing was unchanged at a reading of -38 on the
month. Construction actually got worse in the month. Despite the
worsening of construction it remains in the 46th
percentile of range since 1991-about a middling reading. Construction
has been pressured for some time. MFG is in the bottom seven percentile
of its range. Wholesaling and
retailing are in the bottom 17th to 22nd
percentile of their respective ranges.
IFO improves, barely
-- The
IFO survey is in the same boat as the rest of the recent economic
indicators. The index is off its low, and rising but still showing
contraction. The improvement in May continued but was very slight for
most sectors. Manufacturing was unchanged at a reading of -38 on the
month. Construction actually got worse in the month. Despite the
worsening of construction it remains in the 46th
percentile of range since 1991-about a middling reading. Construction
has been pressured for some time. MFG is in the bottom seven percentile
of its range. Wholesaling and
retailing are in the bottom 17th to 22nd
percentile of their respective ranges.
Outlook uncertain -- Germany is still quite weak. There is a legacy of bottoming and rebounding but on the other hand the rebound trends is a mild gradient and the sense of upward momentum is slight. The future is still in doubt.
| Summary of IFO Sector Diffusion readings: CLIMATE | ||||||||
|---|---|---|---|---|---|---|---|---|
| CLIMATE Sum | Current | Last Mo | Since Jan 1991* | |||||
| May-09 | Apr-09 | average | Median | Max | Min | range | % range | |
| All Sectors | -32.1 | -33.1 | -9.0 | -9.6 | 17.5 | -36.2 | 53.7 | 7.6% |
| MFG | -38.0 | -38.0 | -1.5 | 0.2 | 27.5 | -42.9 | 70.4 | 7.0% |
| Construction | -26.3 | -24.3 | -29.0 | -30.3 | 0.7 | -50.1 | 50.8 | 46.9% |
| Wholesale | -28.3 | -30.6 | -14.4 | -16.0 | 23.9 | -39.0 | 62.9 | 17.0% |
| Retail | -21.2 | -26.5 | -15.6 | -15.0 | 19.2 | -40.2 | 59.4 | 32.0% |
| Services | -5.0 | -7.0 | 11.0 | 9.5 | 28.5 | -14.5 | 43.0 | 22.1% |
by Tom Moeller May 26, 2009
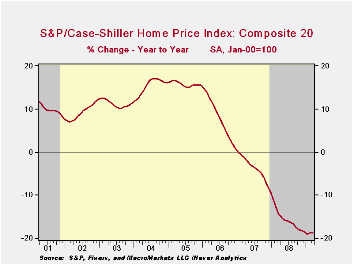 The S&P/Case-Shiller Composite 20
Home Price Index fell 2.2% during March. The latest decline lowered
prices by 18.7% during the last twelve months and by 31.4% since their
peak in May 2006. The series dates back only to 2000 and the
March decline in prices was as expected.
The S&P/Case-Shiller Composite 20
Home Price Index fell 2.2% during March. The latest decline lowered
prices by 18.7% during the last twelve months and by 31.4% since their
peak in May 2006. The series dates back only to 2000 and the
March decline in prices was as expected.
The S&P/Case-Shiller home price series can be found in Haver's USECON database and the city data highlighted below is in the REGIONAL database.
The Case-Shiller index of 20 U.S. cities and their surrounding areas is weighted to reflect price changes due to extensive remodeling, home additions or extreme neglect. For example, smaller weights are assigned to sales of homes that have undergone extensive remodeling.
The Case-Shiller composite index of homes in 10 metropolitan areas, which has a longer history and dates back to 1987, also fell 2.0% and was down 18.6% year-to-year. The measure was down 32.4% since the 2006 peak.
Weakest Regions: Home prices in Phoenix,
Nevada were quite weak and fell 36.0% y/y and in San Francisco prices
fell 30.0% y/y, off by nearly one half from their early-2006 peak. Home
prices in Las Vegas, Nevada fell 31.2% y/y and also were down by
roughly one half from their peak. Prices in Miami fell 28.7% y/y while
home prices in Los Angeles were down 22.3% y/y. In Tampa they fell
22.4% and in Detroit home prices dropped by 25.7% y/y, off 43.7% from
the peak.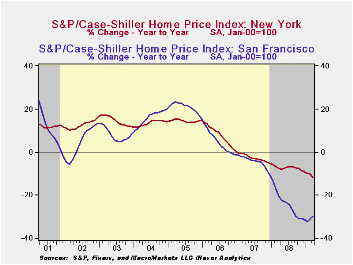
Less Weak Regions: In the Northeast, the decline in home prices continued less severe. Prices in New York fell 11.8% y/y, off 19.6% from their 2006 peak. Prices were down 8.0% year-to-year in Boston but in Chicago home prices were down a larger 18.6% y/y, off one-quarter from the 2007 peak. In Cleveland, Ohio the decline in home prices accelerated during February and they fell 1.0% m/m and 9.0% y/y but in Dallas prices were off by a moderate 5.5% y/y and by 9.1% from the 2007 peak. In Charlotte, North Carolina prices fell a moderate 9.3% y/y and in Denver home prices prices fell just 5.5% y/y.
The latest press release from Standard & Poor's can be found here. An overview of the S&P/Case-Shiller home price series can be found here.
The history of the Case-Shiller data is available in Haver's USECON database.
Remarks made by Fed Chairman Ben S. Bernanke on Dealing With The Reality of Unpredictability are available here.
| S&P/Case-Shiller Home Price Index (SA, Jan 00 = 100) | March | February | Y/Y | 2008 | 2007 | 2006 |
|---|---|---|---|---|---|---|
| 20 City Composite Index | 141.35 | 144.48 | -18.7% | -15.8% | -3.8% | 7.6% |
by Tom Moeller May 26, 2009
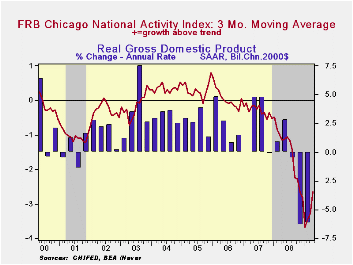 The Chicago Federal Reserve
Bank reported that its National
Activity Index improved during April to the highest level since October
of last year. The reading of -2.06 was up from a downwardly revised
March figure. Both figures were up from the series' low of -3.99
reached this past January. Since 1970 there has been a 74% correlation
between the level of the index and the q/q change in real GDP.
The Chicago Federal Reserve
Bank reported that its National
Activity Index improved during April to the highest level since October
of last year. The reading of -2.06 was up from a downwardly revised
March figure. Both figures were up from the series' low of -3.99
reached this past January. Since 1970 there has been a 74% correlation
between the level of the index and the q/q change in real GDP.
The three-month moving average of the index also improved to its highest level since December.
An index level at or below -0.70 typically has indicated negative U.S. economic growth. A zero value of the CFNAI indicates that the economy is expanding at its historical trend rate of growth of roughly 3%. The complete CFNAI report is available here.
The production and income components made the largest positive contributions to the April CFNAI. Twenty-two of the index components had a positive influence while 63 made a negative contribution.
The CFNAI is a weighted average of 85 indicators of economic activity. The indicators reflect activity in the following categories: production & income, the labor market, personal consumption & housing, manufacturing & trade sales, and inventories & orders.
In a separate survey, the Chicago Fed indicated that its Midwest manufacturing index fell during March to its lowest level since 1994. Indicators for the steel, machinery and resource sectors each fell sharply but the measure for the auto sector rose.
The Chicago Federal Reserve figures are available in Haver's SURVEYS database.
Interactions between Monetary and Fiscal Policy in the Current Situation is last week's speech by Fed Vice Chairman Donald L. Kohn and it can be found here.
| Chicago Fed | April | March | April '08 | 2008 | 2007 | 2006 |
|---|---|---|---|---|---|---|
| CFNAI | -2.06 | -3.36 | -1.06 | -1.78 | -0.36 | 0.03 |
| 3-Month Moving Average | -2.65 | -3.39 | -1.15 | -- | -- | -- |
by Robert Brusca May 26, 2009
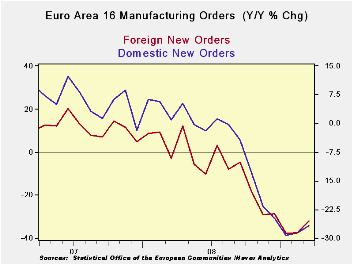 Order trends have
deteriorated for both EMU domestic and
foreign orders but each series also shows signs of a turn. Three month
rates of growth are not as bad as six month rates of growth although
six month rates of growth are worse than Yr/Yr rates of growth.
February had posted some positive rates of growth for EMU in the month.
Those turned negative in March. But that has been enough to blunt the
slide in the growth rates. Still it is not a picture of growth, rather
it’s a hint of putting the worst behind us – a rather common theme by
now.
Order trends have
deteriorated for both EMU domestic and
foreign orders but each series also shows signs of a turn. Three month
rates of growth are not as bad as six month rates of growth although
six month rates of growth are worse than Yr/Yr rates of growth.
February had posted some positive rates of growth for EMU in the month.
Those turned negative in March. But that has been enough to blunt the
slide in the growth rates. Still it is not a picture of growth, rather
it’s a hint of putting the worst behind us – a rather common theme by
now.
We can also learn something of the EMU situation from the new
details released on German GDP in 2009-Q1
German GDP was rocked in 2009-Q1 by a huge pullback in capital
spending a flow that receded at a 50% annual rate. Exports shrank at a
stunning 34% annual rate and imports fell at nearly a 20% annual rate
(buffering the slide in GDP). The theme of weak investment was extended
by housing where investment fell at a comparatively tepid 10% pace. The
weakness in capital formation spending dropped domestic demand at
nearly a 6.8% annual rate.
Over the past year GDP fell by nearly 7%, a huge Yr/Yr drop,
led by capital formation and export weakness. In the quarter consumer
spending rose but over one year it is lower by just a tick. Germany’s
weakness is not a product of consumer weakness. And with strong social
welfare spending programs the likelihood of keeping a spillover to the
consumer in check is good.
Germany, an important exporting nation, clearly it is
importing a great deal of its weakness from abroad. In that respect it
is encouraging that Germany has seen its orders jump by 3% in March.
That hardly means that the episode of weakness in over. But it suggests
that forces that will put an end to contraction may be in train. That
is just another version of the same story that things are better than
they were but not yet showing growth. Still that is the nature of
recessions as they turn to recovery. You have to look for a gradual
cessation of the slowing and a switch to a period of what will probably
appear to be sporadic growth which then could develop more vigor. We
are now just at the cusp where the declines in growth slow and we only
seen a few scattered signs of growth. We are a ways from seeing
consistent growth and any sort of strength.
| Euro Area 16 and UK Industrial Orders | |||||||||
|---|---|---|---|---|---|---|---|---|---|
| Saar except m/m | Mo/Mo | Mar-09 | Feb-09 | Mar-09 | Feb-09 | Mar-09 | Feb-09 | ||
| Euro Area Overview | Mar-09 | Feb-09 | Jan-09 | 3-Mo | 3-Mo | 6-mo | 6-mo | 12-mo | 12-mo |
| Total Orders | -0.8% | 0.0% | -2.0% | -11.0% | -38.8% | -44.5% | -48.4% | -31.3% | -32.0% |
| E-16 Domestic MFG orders | -1.5% | 0.8% | -1.2% | -7.2% | -30.3% | -38.6% | -44.9% | -26.8% | -28.5% |
| E-16 Foreign MFG orders | -0.4% | 1.1% | -7.2% | -23.5% | -42.4% | -48.2% | -49.8% | -32.0% | -37.3% |
| Countries: | Mar-09 | Feb-09 | Jan-09 | 3-Mo | 3-Mo | 6-mo | 6-mo | 12-mo | 12-mo |
| Germany (MFG): | 3.3% | -3.3% | -8.0% | -28.8% | -55.2% | -47.4% | -58.1% | -34.5% | -37.5% |
| France (Ind): | -6.7% | 6.7% | -2.5% | -11.3% | 13.8% | -33.7% | -27.9% | -23.9% | -23.2% |
| Italy (Ind): | -2.7% | -2.1% | -3.9% | -29.6% | -27.5% | -39.8% | -39.4% | -29.8% | -31.2% |
| UK (Engineering Ind): | -1.1% | 17.3% | -32.5% | -62.5% | -3.0% | -48.6% | -16.0% | -14.6% | -23.3% |
| German GDP | ||||||||
|---|---|---|---|---|---|---|---|---|
| Consumption | Capital Formation | Domestic | ||||||
| GDP | Private | Public | Total | Housing | Exports | Imports | Demand | |
| % change Q/Q; X-M is Q/Q change in Blns of euros | ||||||||
| Q1-09 | -14.4% | 1.8% | 1.0% | -50.7% | -9.9% | -33.4% | -19.8% | -6.8% |
| Q4-08 | -8.6% | -1.1% | -0.3% | -18.3% | -5.0% | -28.6% | -15.4% | -0.2% |
| Q3-08 | -2.1% | 1.0% | 0.5% | 1.1% | -0.6% | -1.6% | 17.0% | 5.6% |
| Q2-08 | -2.0% | -2.0% | 2.0% | 2.3% | -13.4% | -0.8% | -6.9% | -4.7% |
| % change Yr/Yr; X-M is Yr/Yr change in Gap in Blns of euros | ||||||||
| Q1-09 | -6.9% | -0.1% | 0.8% | -19.7% | -7.3% | -17.5% | -7.3% | -1.6% |
| Q4-08 | -1.8% | -0.6% | 1.5% | -2.4% | 0.3% | -6.3% | 1.2% | 1.9% |
| Q3-08 | 0.8% | -0.4% | 1.9% | 6.5% | 2.0% | 3.2% | 5.2% | 1.5% |
| Q2-08 | 2.0% | -0.4% | 2.1% | 7.8% | 2.8% | 5.4% | 3.9% | 1.1% |
| 5-Yrs | 0.3% | 0.2% | 1.0% | 2.3% | -0.2% | 3.2% | 4.7% | 0.7% |
by Tom Moeller May 26, 2009
 Consumers'
attitudes are rising even further on expectations
that the worst of the recession has passed. The May index of consumer
confidence, reported by the Conference Board, improved for the third
consecutive month and the latest two gains have been quite sharp.
Rising to its highest level since last September, the reading of 54.9
was up by more than half from the February low. Despite the gains,
however, the index level remained down by one half from the 2007 highs.
The latest figure was quite a bit firmer than Consensus expectations
for a reading of 43.0.
Consumers'
attitudes are rising even further on expectations
that the worst of the recession has passed. The May index of consumer
confidence, reported by the Conference Board, improved for the third
consecutive month and the latest two gains have been quite sharp.
Rising to its highest level since last September, the reading of 54.9
was up by more than half from the February low. Despite the gains,
however, the index level remained down by one half from the 2007 highs.
The latest figure was quite a bit firmer than Consensus expectations
for a reading of 43.0.
The Conference Board data can be found in Haver's CBDB database.
During the last ten years there has been an 86% correlation between the level of consumer confidence and the y/y change in real consumer spending.
Following a firm gain in April, the expectations component
again drove the rise in confidence this month with a 41.8% m/m rise.
The latest monthly increases have driven the index to the highest level
since late 2007. The percentage of respondents expecting business
conditions to improve jumped again to 23.1% which was the highest level
since 2004. A reduced 17.8% expected conditions to worsen. That
improvement was expected by 20.0% of respondents to generate more jobs,
nearly triple the percentage at the recent low.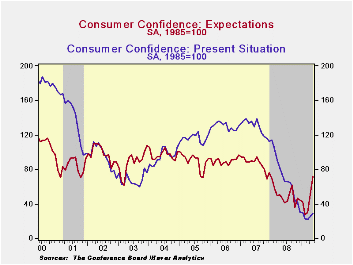
Consumers' assessment of the current economic conditions has yet, however, to improve much at all. The present conditions index rose just modestly and remained near its recent low. It remained off by nearly two-thirds from a year earlier. Jobs were seen as hard to get by a slightly reduced 44.7% of respondents, still near the highest since 1992, and jobs were seen as plentiful by only 5.7% of respondents. Business conditions were seen as good by just 8.7% and that was near the 1991 low. Consumers who thought business conditions were bad rose slightly to 45.3%, still near the highest since 1983.
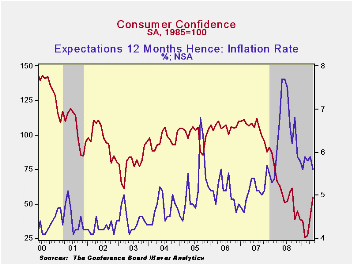
Expectations for the inflation rate in twelve months have been roughly stable since November at 5.6%. That's down from last year's high of 7.7%. Expectations about interest rates have started to increase with 47.0% of respondents expecting higher rates while 18.1% expect rates to fall. A greatly increased 35.8% of respondents expected stock prices to rise.
| Conference Board (SA, 1985=100) | May | April | Y/Y % | 2008 | 2007 | 2006 |
|---|---|---|---|---|---|---|
| Consumer Confidence Index | 54.9 | 40.8 | -5.5 | 57.9 | 103.4 | 105.9 |
| Present Situation | 28.9 | 25.5 | -61.1 | 69.9 | 128.8 | 130.2 |
| Expectations | 72.3 | 51.0 | 52.9 | 50.0 | 86.4 | 89.7 |

Robert Brusca
AuthorMore in Author Profile »Robert A. Brusca is Chief Economist of Fact and Opinion Economics, a consulting firm he founded in Manhattan. He has been an economist on Wall Street for over 25 years. He has visited central banking and large institutional clients in over 30 countries in his career as an economist. Mr. Brusca was a Divisional Research Chief at the Federal Reserve Bank of NY (Chief of the International Financial markets Division), a Fed Watcher at Irving Trust and Chief Economist at Nikko Securities International. He is widely quoted and appears in various media. Mr. Brusca holds an MA and Ph.D. in economics from Michigan State University and a BA in Economics from the University of Michigan. His research pursues his strong interests in non aligned policy economics as well as international economics. FAO Economics’ research targets investors to assist them in making better investment decisions in stocks, bonds and in a variety of international assets. The company does not manage money and has no conflicts in giving economic advice.
More Economy in Brief


