 Global| Sep 23 2004
Hurricanes Lifted Claims for Jobless Insurance
by:Tom Moeller
|in:Economy in Brief
Summary
Initial claims for unemployment insurance jumped 14,000 last week to 350,000 after an upwardly revised 18,000 gain the prior week. Consensus expectations had been for 335,000 claims. The US Labor Department indicated that last week's [...]
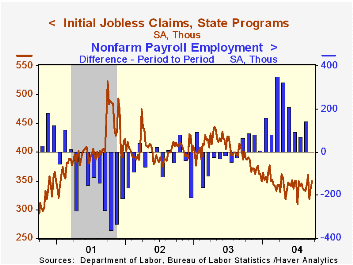
Initial claims for unemployment insurance jumped 14,000 last week to 350,000 after an upwardly revised 18,000 gain the prior week. Consensus expectations had been for 335,000 claims.
The US Labor Department indicated that last week's claims number primarily reflected hurricanes Charley & Frances. Hurricane Ivan has yet to be reflected in the claims figures.
The latest figure is for the September survey period for nonfarm payrolls and initial claims were 17,000 (5.1%) higher than in the August period.
The 4-week moving average of initial claims was stable at 341,000 (-15.5% y/y). During the last ten years there has been an 81% (negative) correlation between the monthly average of initial claims and the y/y change in payroll employment.
Continuing claims for unemployment insurance rose 5,000 following a deepened 9,000 decline the week prior.
The insured rate of unemployment remained at 2.3%, where it has hovered since the end of April.
"Labor's Share" from the Federal Reserve Bank of St. Louis can be found here.
| Unemployment Insurance (000s) | 09/18/04 | 09/11/04 | Y/Y | 2003 | 2002 | 2001 |
|---|---|---|---|---|---|---|
| Initial Claims | 350 | 336 | -9.6% | 399 | 403 | 403 |
| Continuing Claims | -- | 2,883 | -19.2% | 3,516 | 3,564 | 2974 |
by Tom Moeller September 23, 2004
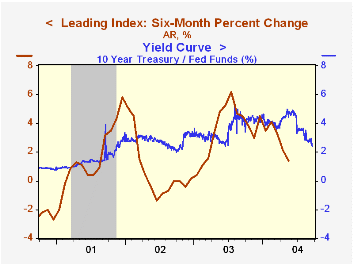
The Conference Board reported that the Composite Index of Leading Economic Indicators for August fell 0.3%, the third consecutive monthly decline. A 0.1% decline had been the Consensus expectation and July's decline was unrevised.
Among the 10 components only 30% rose over a one month span. A narrowing of the yield curve and lower building permits had the largest negative influences. Over a six month span 70% of the leaders rose.
The leading index is based on eight previously reported economic data series. Two series, orders for consumer goods and orders for capital goods, are estimated.
A 1997 article from the Federal Reserve Bank of St. Louis titled "Strengthening the Case for the Yield Curve as a Predictor of U.S. Recessions" can be found here.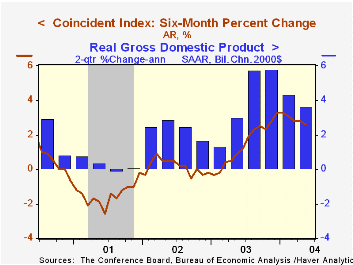
The coincident indicators rose 0.2% and has not declined m/m since April of last year. During the last ten years there has been an 82% correlation between the six month growth in the coincident indicators and two quarter growth in real GDP.
The lagging indicators fell 0.1% and the ratio of the coincident to the lagging indicators, a measure of how the economy is performing relative to its excess, rose for the first month in three.
Visit the Conference Board's site for coverage of leading indicator series from around the world.
| Business Cycle Indicators | Aug | July | 6-Month Growth | 2003 | 2002 | 2001 |
|---|---|---|---|---|---|---|
| Leading | -0.3% | -0.3% | 2.8% | 1.3% | 2.2% | -0.8% |
| Coincident | 0.2% | 0.2% | 2.4% | 0.4% | -0.5% | -0.5% |
| Lagging | -0.1% | 0.6% | -1.3% | -2.2% | -2.8% | -1.4% |
by Tom Moeller September 23, 2004
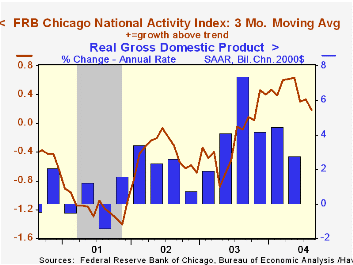
The Chicago Fed National Activity Index (CFNAI) fell last month to 0.19 following a sharp improvement in July.
The three-month moving average of the CFNAI also fell to its lowest level of the year.
A zero value of the CFNAI indicates that the economy is expanding at its historical trend rate of growth.
During the last twenty years there has been a 74% correlation between the level of the CFNAI and q/q growth in real GDP.
The CFNAI is a weighted average of 85 indicators of economic activity. The indicators reflect activity in the following categories: production and income, the labor market, personal consumption and housing, manufacturing and trade sales, and inventories & orders.
A recent speech by Fed Governor Edward M. Gramlich titled "Oil Shocks and Monetary Policy" is available here.
| Chicago Fed | Aug | July | Aug '03 | 2003 | 2002 | 2001 |
|---|---|---|---|---|---|---|
| CFNAI | 0.19 | 0.53 | -0.44 | -0.11 | -0.40 | -1.19 |

Tom Moeller
AuthorMore in Author Profile »Prior to joining Haver Analytics in 2000, Mr. Moeller worked as the Economist at Chancellor Capital Management from 1985 to 1999. There, he developed comprehensive economic forecasts and interpreted economic data for equity and fixed income portfolio managers. Also at Chancellor, Mr. Moeller worked as an equity analyst and was responsible for researching and rating companies in the economically sensitive automobile and housing industries for investment in Chancellor’s equity portfolio. Prior to joining Chancellor, Mr. Moeller was an Economist at Citibank from 1979 to 1984. He also analyzed pricing behavior in the metals industry for the Council on Wage and Price Stability in Washington, D.C. In 1999, Mr. Moeller received the award for most accurate forecast from the Forecasters' Club of New York. From 1990 to 1992 he was President of the New York Association for Business Economists. Mr. Moeller earned an M.B.A. in Finance from Fordham University, where he graduated in 1987. He holds a Bachelor of Arts in Economics from George Washington University.
More Economy in Brief


