 Global| Oct 19 2005
Housing Starts Firm
by:Tom Moeller
|in:Economy in Brief
Summary
Housing starts remained firm last month and rose 3.4% m/m to 2.108M units.The prior month's figure was revised slightly higher and the September gain far outpaced Consensus expectations for a decline to 1.97M starts. The Census Bureau [...]
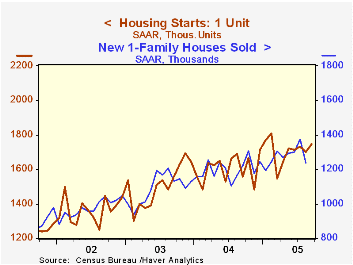
Housing starts remained firm last month and rose 3.4% m/m to 2.108M units.The prior month's figure was revised slightly higher and the September gain far outpaced Consensus expectations for a decline to 1.97M starts.
The Census Bureau indicated that the impact of Hurricane Katrina on the figures was minimal.
Single-family starts rose 2.6% due to 6.2% gains in both the South (14.0% y/y) and in the Midwest (7.3% y/y). In the Northeast, single family starts rose 0.7% (17.2% y/y) and in the West single family starts fell 5.3% (+11.7% y/y).
Multi family starts rose 7.8% m/m after an upwardly revised 1.5% August gain.
Federal Reserve Board Vice-Chairman Roger W. Ferguson's speech on the Economic Outlook for the United States can be found here.
| Housing Starts (000s, AR) | Sept | Aug | Y/Y | 2004 | 2003 | 2002 |
|---|---|---|---|---|---|---|
| Total | 2,108 | 2,038 | 10.3% | 1,950 | 1,854 | 1,710 |
| Single-family | 1,747 | 1,703 | 12.3% | 1,604 | 1,505 | 1,363 |
| Multi-family | 361 | 335 | 1.1% | 345 | 349 | 347 |
| Building Permits | 2,189 | 2,138 | 7.4% | 2,058 | 1,8 88 | 1,749 |
by Tom Moeller October 19, 2005
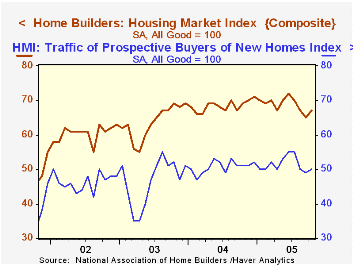
Following three consecutive months of decline, the National Association of Home Builders' (NAHB) Composite Housing Market Index gained back in October all of the September drop with a 3.1% increase. Nevertheless the index remained 6.9% below the June peak.
During the last twenty years, year to year changes in the annual composite index had an 85% correlation with the change in single family housing starts.
The m/m increase reflected strong gain throughout the country except in the Northeast.
The October index for sales of single family homes in six months gained back one third of the prior month's 9.1% drop (-8.9% y/y) while the index for current sales reversed all of a modest September fall (-3.9% y/y).
The NAHB index is a diffusion index based on a survey of builders. Readings above 50 signal that more builders view conditions as good than poor.
Visit the National Association of Home Builders.
| Nat'l Association of Home Builders | Oct | Sept | Oct '04 | 2004 | 2003 | 2002 |
|---|---|---|---|---|---|---|
| Composite Housing Market Index | 67 | 65 | 69 | 68 | 64 | 61 |
by Tom Moeller October 19, 2005
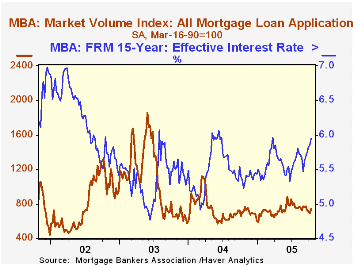
According to the Mortgage Bankers Association, the total number of mortgage applications rose 6.1% last week and reversed most of the declines during the prior three periods although applications so far in October remained 4.2% below the September average.
Purchase applications jumped 7.3% w/w and pulled this month's level 1.5% below September's which rose 1.0% from August. During the last ten years there has been a 49% correlation between the y/y change in purchase applications and the change in new plus existing single family home sales.
Applications to refinance reversed nearly all of the prior week's decline with a 4.5% rise.
The effective interest rate on a conventional 30-year mortgage rose further to 6.35% and is up from 6.03% averaged in September. The low for 30 year financing was 5.71% in late June. The effective rate on a 15-year mortgage rose to 5.95% and increased from the low of 5.33%. The interest rate on 15 and 30 year mortgages are closely correlated (>90%) with the rate on 10 year Treasury securities.
The Mortgage Bankers Association surveys between 20 to 35 of the top lenders in the U.S. housing industry to derive its refinance, purchase and market indexes. The weekly survey accounts for more than 40% of all applications processed each week by mortgage lenders. Visit the Mortgage Bankers Association site here.
| MBA Mortgage Applications (3/16/90=100) | 10/14/05 | 10/07/05 | Y/Y | 2004 | 2003 | 2002 |
|---|---|---|---|---|---|---|
| Total Market Index | 737.5 | 694.8 | 3.9% | 735.1 | 1,067.9 | 799.7 |
| Purchase | 503.9 | 469.5 | 9.2% | 454.5 | 395.1 | 354.7 |
| Refinancing | 2,095.7 | 2,004.9 | -2.8% | 2,366.8 | 4,981.8 | 3,388.0 |
by Carol Stone October 19, 2005
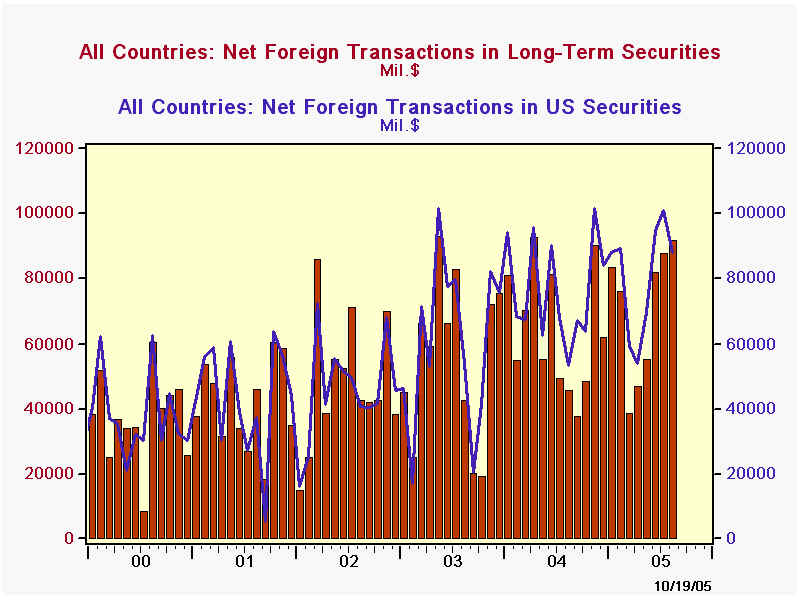
Yesterday's report by the US Treasury of net purchases of securities by foreign investors indicated the third largest monthly amount ever in August, $91.3 billion. This followed two other sizable amounts, $87.5 billion in July and $81.8 billion in June, making a record large three-month total, $260.6 billion, nearly $20 billion more than the prior record cumulative volume in July 2003.
In one sense, the August data are quirky and may not be sustained. The big total resulted from enormous net purchases of foreign bonds in US markets. Although partly offset by sales of foreign equities, the foreign investor activity in "Yankee" bonds and stocks swung to $3.4 billion in net purchases after 17 consecutive months of net sales.The spurt in foreign bond acquisition to $17 billion is far out of line with prior experience, so it will be interesting to see whether it continues or is quickly reversed.Otherwise, transactions in US securities actually moderated a bit in August. They totaled $87.8 billion, down from $101.2 billion in July. Purchases of federal agencies, so-called "GSEs" (government-sponsored enterprises) dropped back, while corporate bond buying picked up and Treasury purchases continue near their 12-month average of $25.3 billion.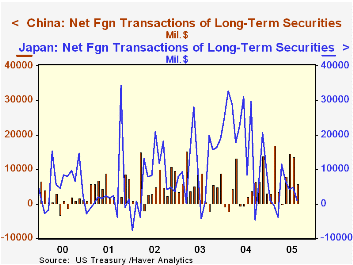
Among countries, that swing in foreign securities apparently came from UK investors. It's important to point out here that these Treasury data represent transactions with the first non-US counterparty, regardless of the nationality of the final owner or seller. Since London is a major global financial center, it could well be investors from elsewhere -- perhaps the Middle East -- who moved out of foreign stocks and into bonds that trade in US markets.China's participation in US markets decreased to $5.7 billion in net purchases in August, but $13.8 billion in July and $14.7 billion in June made the largest two-month period by far; China's activity is quite erratic, and the let-up in August is actually fairly moderate compared with a sharp saw-tooth pattern that is frequently in evidence. Japan's net investments, by contrast, have slowed markedly the last several months after a large increase in 2004 and were only $1.2 billion in August.
| Net Foreign Purchases of Securities in US Markets (Billions US$) | Aug 2005 | July 2005 | June 2005 | Last 12 Months' Average | Monthly Average|||
|---|---|---|---|---|---|---|---|
| 2004 | 2003 | 2002 | |||||
| Total | 91.3 | 87.5 | 81.8 | 66.3 | 63.6 | 55.3 | 47.9 |
| Treasuries | 28.1 | 28.5 | 15.8 | 25.3 | 29.3 | 22.0 | 10.0 |
| Federal Agencies (mostly "GSEs") | 15.6 | 37.8 | 20.3 | 19.8 | 18.9 | 13.0 | 16.3 |
| US Corporate Bonds | 40.3 | 24.9 | 54.4 | 29.6 | 25.1 | 22.1 | 15.2 |
| US Corporate Stocks | 3.8 | 10.0 | 4.4 | 5.1 | 2.4 | 2.9 | 4.2 |
| Foreign Bonds | 17.0 | -5.1 | -1.2 | -4.3 | -5.6 | 2.7 | 2.4 |
| Foreign Stocks | -13.5 | -8.7 | -11.8 | -9.4 | -7.1 | -7.4 | -0.1 |

Tom Moeller
AuthorMore in Author Profile »Prior to joining Haver Analytics in 2000, Mr. Moeller worked as the Economist at Chancellor Capital Management from 1985 to 1999. There, he developed comprehensive economic forecasts and interpreted economic data for equity and fixed income portfolio managers. Also at Chancellor, Mr. Moeller worked as an equity analyst and was responsible for researching and rating companies in the economically sensitive automobile and housing industries for investment in Chancellor’s equity portfolio. Prior to joining Chancellor, Mr. Moeller was an Economist at Citibank from 1979 to 1984. He also analyzed pricing behavior in the metals industry for the Council on Wage and Price Stability in Washington, D.C. In 1999, Mr. Moeller received the award for most accurate forecast from the Forecasters' Club of New York. From 1990 to 1992 he was President of the New York Association for Business Economists. Mr. Moeller earned an M.B.A. in Finance from Fordham University, where he graduated in 1987. He holds a Bachelor of Arts in Economics from George Washington University.
More Economy in Brief


