 Global| Aug 07 2020
German IP on the Mend
Summary
June provides the last observation to complete second quarter data. With that, all full Q2 gauges show extreme weakness. However, IP also clocks improvement and mostly two-months-in-a-row of improvement in June and May- that is two- [...]
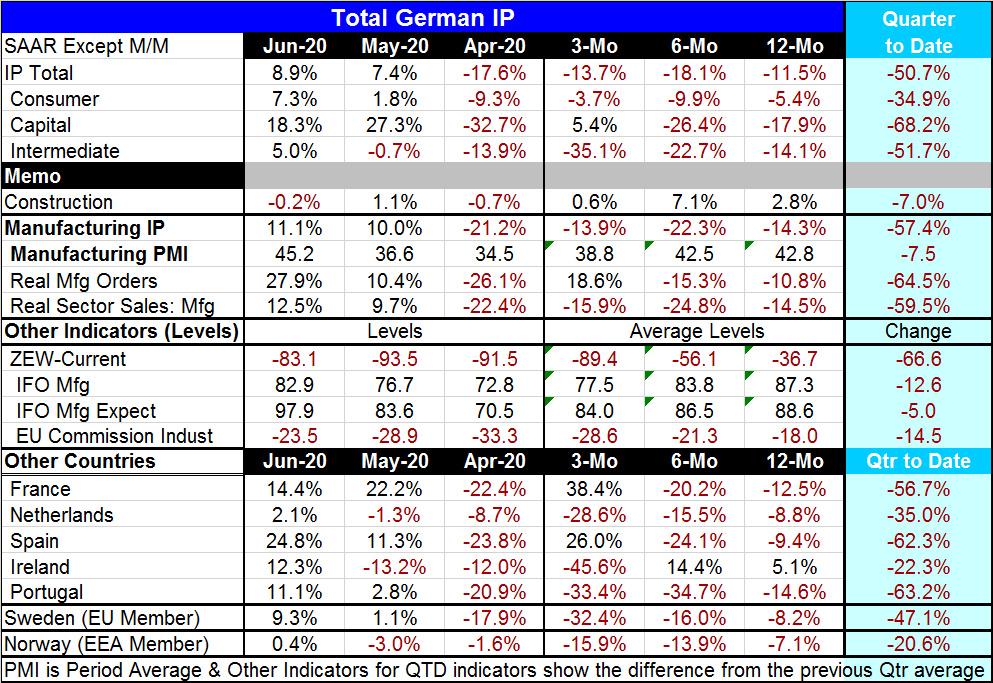
 June provides the last observation to complete second quarter data. With that, all full Q2 gauges show extreme weakness. However, IP also clocks improvement and mostly two-months-in-a-row of improvement in June and May- that is two-thirds of the quarter. Yet, the quarter’s results are deeply negative. This is because of extreme weakness in March and April that combined to reduce output to extremely low levels in April. Note that I include March in this even though March is a Q1 figure. Even as Germany has logged headline output increases month-to-month of 7.4% in May and 8.9% in June, output is still falling in the quarter at a 50.7% annual rate! But the three-month growth rate which is simply the ratio of June to March annualized show a much smaller annual rate decline of -13.7%. Quarterly growth comparisons look at the ratio of one quarter’s average to the previous quarter’s average annualized. In this case, the three-month comparison might be a better gauge of how growth is progressing. Remember that next month the three-month calculation will shift its base from March (93.8) to April (77.3) and the June value (90.4) is already above the April value. Forecasting a strong rise for the three-month gain in output is a matter of arithmetic not economics – the same is true of forecasting a gain for Q3 over Q2.
The calculus of slippage and recovery
This is a reminder that when we calculate growth rates from one period to the next in a time series, there are two moving parts to the calculation: (1) the new level of the current month is incorporated and (2) the base for the calculation is shifted forward. Usually the focus is on step (1), but step (2) is at least equally important especially when data have been volatile. In this case, there is a reversal in train as IP is shifting from a (rapid) declining phase to a (rapid) recovery phase. So the shifting of the base and growth of output is going to create a powerful ‘slingshot’ action as the monthly data take IP out of its declining torpor and thrust it into an extreme expansion pace. With the new number rising and the base still falling, the impact on growth is going to be magnified. For example, even if the output index is unchanged in July, the mere shifting of the base from March to April will move the German annualized three-month growth rate for output up to a pace of 87% from its current -13.7% pace! That is with nothing changing in the new month but only from using a different base.
An upbeat Q3 ahead...but what does that mean?
Obviously, Germany is headed for a substantial recovery in growth in Q3. And since the whole economy is making this same sort of turn at more or less the same time, we are about so see a number of German growth calculations for various indicators make a sharp turn, too- that includes GDP. However, under these same conditions of unchanged output in July compared to June, the year-on-year growth rate will/would register a drop of 11.4%. This is because German output is only registering strong growth as it is climbing the wall of the canyon it dropped into, but it is still subpar compared to lip of the canyon on the far side before it fell into this abyss.
The context of data in a recovery-expansion
All of this is more a discussion of the arithmetic of data presentation than of economics. But it is important because we will be vetting economic performance by the numbers that print. The image of falling into a canyon and seeing a collapse in the data and then seeing a sharp reversal as we climb out the other side is a good one; the image of making strong vertical growth over a short span as we climb out while still being below the lip of the canyon before we fell in is also apropos. This image reminds us that as we assess these various growth rates, we will have to make a number of assessments to figure out how we are progressing. We will need constant references to older landmarks to decide when the recovery process is complete. Short-term growth rates are not going to be enough no matter how impressive they seem.
What the data tell us now
For now, setting the actual numbers aside, we see growth in total output of consumer goods, output of capital goods and output of intermediate goods in each sector logs accelerating growth from April to May to June except for the capital goods sector that logged a huge growth rate in May could not sustain that pace in June. Manufacturing as a whole shows acceleration over these three months but construction is still erratic. I will not pay much attention to the sequential growth rates from 12-months to six-months to three-months because the sort of arithmetic we discuss above is at work and with the economy turning higher whatever trend they happen to sketch is more a matter of the arithmetic of the pattern than of the economics of the process.
Monthly trends on real manufacturing orders and real sector sales show not just growth but acceleration in progress. The ZEW current index instead of showing ongoing monthly progress logs a weakening in May compared to April then records a strong improvement in June. IFO manufacturing expectations log steady improvements from April to June and strong improvements in expectations on that timeline. The EU Commission’s assessment for the industrial sector shows solid ongoing improvement. In sum, the survey data largely match the more comprehensive and more precise industrial production report. That is satisfying.
Other Europe
A few other European countries have early releases of industrial output data. These include five EMU members and two non-EMU members: Sweden and Norway. Among these seven countries, all have output increases in June. And all but Norway have strong output increases in June. Four countries have two monthly output increases in a row in May and June. The Netherlands, Ireland and Norway are exceptions posting declines in output in May. All show steep declines in month-to-month output in April so in their own way each of these countries is starting to climb the wall to get out of the chasm they fell into because of the virus.
The virus
The virus continues to provide problems for recovery and new infections are flaring up in a number of countries; that include the United States where quite varied conditions of virus infection exist across states. The virus is already slowing the expansion in the U.S. and it is causing Europe to pull back in different places at difference paces. It remains unclear what the path ahead looks like. I am afraid that too much attention is placed on the development of a vaccine since there is no known production process for the creation of a vaccine that leads inexorably to the invention of one! Developing a vaccine is speculative. It is not like putting frame on the assembly line and knowing it is going to emerge at the other end as a truck by the end of the day. Yet, a lot of people seem to have NO problem putting all their eggs in the great basket of the unknown while trashing the President for polices that are controversial according to today’s standards but that might prove to have been better in the long run. And vaccines often do not work well on the old and on people with compromised immune systems – and yet these are exactly the type of people that need one. For them a vaccine may be no answer at all and if that is truly what happens we will have just wasted this time waiting for Godot and his magic elixir. Those who drink the Kool Aid of conventional wisdom better make sure that they are not allergic to it and that their vaccine is going to be safe and delivered without much delay. In fact, we know NONE of those conditions actually will hold in real life and yet those who condescend to others and spout ‘trust science’ have all their eggs in the vaccine basket that has far too many holes in its bottom for that basket to be safe. But that is where we are in this vaunted age of science. We are rolling the dice and hoping they don’t come up snake eyes. Trust science!

Robert Brusca
AuthorMore in Author Profile »Robert A. Brusca is Chief Economist of Fact and Opinion Economics, a consulting firm he founded in Manhattan. He has been an economist on Wall Street for over 25 years. He has visited central banking and large institutional clients in over 30 countries in his career as an economist. Mr. Brusca was a Divisional Research Chief at the Federal Reserve Bank of NY (Chief of the International Financial markets Division), a Fed Watcher at Irving Trust and Chief Economist at Nikko Securities International. He is widely quoted and appears in various media. Mr. Brusca holds an MA and Ph.D. in economics from Michigan State University and a BA in Economics from the University of Michigan. His research pursues his strong interests in non aligned policy economics as well as international economics. FAO Economics’ research targets investors to assist them in making better investment decisions in stocks, bonds and in a variety of international assets. The company does not manage money and has no conflicts in giving economic advice.
More Economy in Brief


