 Global| Dec 22 2004
German IFO Improves in December
Summary
Germany's IFO Business Climate Index rose 2.3 points in December to 96.2, the highest in eight months. Both the Business Situation (Current Conditions) and Expectations components participated in the gain. This was only the third [...]
Germany's IFO Business Climate Index rose 2.3 points in December to 96.2, the highest in eight months. Both the Business Situation (Current Conditions) and Expectations components participated in the gain. This was only the third month during all of 2004 that both increased at the same time. And only the second time that the two major German business surveys, the IFO and ZEW, had positive results simultaneously. This was also the largest monthly increase in the IFO since the winter of 2002. [Preliminary "headline" IFO data were reported last Friday, and more detail were published this morning.]
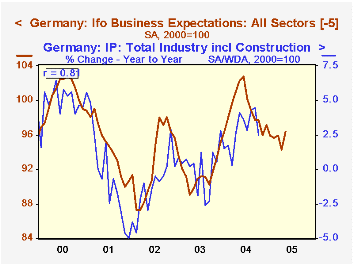
Is the upturn in the IFO of any consequence? Do German business executives express a realistic vision about business conditions they face?Apparently they do, at least where production is concerned. Over the last five years, there has been an 80% correlation between the Business Situation (current conditions) Index and the year-to-year percentage change in industrial production. This is helpful, since the survey takes place two months ahead of the publication of the production data; that is, while this is the December IFO survey, industrial production is available only through October.
Further, the business expectations component appears to be a reliable leading indicator of production growth. In the coincident month, expectations have only a 53% correlation with production. But if expectations behave as intended, they should point to the upcoming trend in production. We can check this easily in Haver DLXVG3; this software enables us to examine simple lead/lag relationships. Using <CNTL> together with the right or left arrow key, we can move the primary series back and forth across the graph; the correlation ratio displayed on the graph will change as we do that. This simple exercise shows that the expectations index has its maximum correlation with production growth, a respectable 81%, five months ahead of the production data. So company leaders appear to have a good grasp of the basic trends in their business, not only in the present, but also looking ahead several months.
| Indexes, 2000=100 | Dec 2004 | Nov 2004 | Oct 2004 |
Year Ago | 2003 | 2002 | 2001 |
|---|---|---|---|---|---|---|---|
| IFO Business Climate | 96.2 | 94.1 | 95.3 | 96.9 | 91.7 | 89.4 | 92.1 |
| IFO Business Situation (Current Conditions) | 96.0 | 93.9 | 94.7 | 91.8 | 94.0 | 88.4 | 85.3 |
| IFO Business Expectations | 96.4 | 94.3 | 95.9 | 102.3 | 95.1 | 93.9 | 91.0 |
| Industrial Production, Yr/Yr % Chg | 2.4 | 1.2 | 0.1 | -1.2 | -0.4 |
Carol Stone, CBE
AuthorMore in Author Profile »Carol Stone, CBE came to Haver Analytics in 2003 following more than 35 years as a financial market economist at major Wall Street financial institutions, most especially Merrill Lynch and Nomura Securities. She had broad experience in analysis and forecasting of flow-of-funds accounts, the federal budget and Federal Reserve operations. At Nomura Securities, among other duties, she developed various indicator forecasting tools and edited a daily global publication produced in London and New York for readers in Tokyo. At Haver Analytics, Carol was a member of the Research Department, aiding database managers with research and documentation efforts, as well as posting commentary on select economic reports. In addition, she conducted Ways-of-the-World, a blog on economic issues for an Episcopal-Church-affiliated website, The Geranium Farm. During her career, Carol served as an officer of the Money Marketeers and the Downtown Economists Club. She had a PhD from NYU's Stern School of Business. She lived in Brooklyn, New York, and had a weekend home on Long Island.
More Economy in Brief


