 Global| Apr 28 2005
Foreign Trade Drag & Prices Up, US GDP Growth Down
by:Tom Moeller
|in:Economy in Brief
Summary
US real GDP growth of 3.1% (AR) in 1Q05 was the slowest in two years and fell short of Consensus expectations for a 3.5% advance. Also a surprise was the 3.3% rise in the GDP Chain Price Index. This strongest gain in four years easily [...]
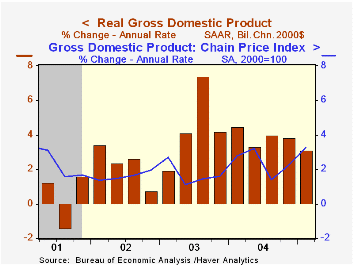
US real GDP growth of 3.1% (AR) in 1Q05 was the slowest in two years and fell short of Consensus expectations for a 3.5% advance. Also a surprise was the 3.3% rise in the GDP Chain Price Index. This strongest gain in four years easily surpassed estimates for a 2.1% increase.
The drag on US output from a deepened foreign trade deficit increased to 1.5 percentage points due to an acceleration in real import growth to 14.7% (10.8% y/y). Growth in auto imports accelerated to 13.7% (5.5% y/y) and nonauto consumer goods imports held steady at 27.8% (15.4% y/y). Capital goods imports slipped to 4.9% (14.3% y/y) and growth in exports more than doubled to 7.0% (5.9% y/y).
The acceleration in the chain price index was due to inventories and a faster 2.2% (1.6% y/y) gain in consumer prices less food & energy. In addition, after two quarters of deflation prices for business equipment & software rose 0.6% (-0.5% y/y). Overall, the price index for domestic demand held about steady at 3.0% but the y/y gain of 2.8% is up from 1.7% a year ago.
Domestic demand growth suffered mostly from slower business investment growth which fell to 4.6% (11.1% y/y) from 14.5% in 4Q. Growth in business fixed investment in computers & software picked up to an even headier 24.3% (15.7% y/y) but spending levels elsewhere fell. Consumer spending growth slipped to 3.5% (3.6% y/y). Less computers real GDP grew 2.5% (3.3% y/y) versus 4.3% growth during 2004.
Faster inventory accumulation contributed the most to output growth in a year. The 1.2% add reflected a change in real private nonfarm inventories of $82.5B which was the fastest since early 2000 and nearly double the 4Q04 rate.
A Big League Economy Tunes Up in Spring Training from the Federal Reserve Bank of Dallas is available here.
| Chained 2000$, % AR | 1Q '05 (Advance) | 4Q '04 (Final) | Y/Y | 2004 | 2003 | 2002 |
|---|---|---|---|---|---|---|
| GDP | 3.1% | 3.8% | 3.6% | 4.4% | 3.0% | 1.9% |
| Inventory Effect | 1.2% | 0.5% | 0.4% | 0.4% | -0.1% | 0.4% |
| Final Sales | 1.9% | 3.4% | 3.2% | 4.0% | 3.1% | 1.4% |
| Trade Effect | -1.5% | -1.4% | -0.8% | -0.4% | -0.3% | -0.7% |
| Domestic Final Demand | 3.2% | 4.5% | 4.0% | 4.4% | 3.4% | 2.1% |
| Chained GDP Price Index | 3.3% | 2.3% | 2.5% | 2.2% | 1.8% | 1.7% |
by Tom Moeller April 28, 2005
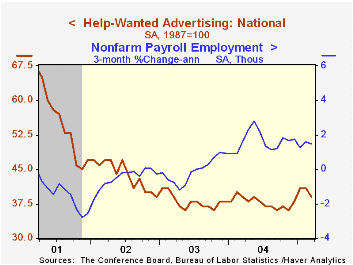
The Conference Board's National March Index of Help-Wanted Advertising fell to 39 from 41 during the prior two months.
During the last ten years there has been a 67% correlation between the level of help-wanted advertising and the three month change in non-farm payrolls.
The proportion of labor markets with rising want-ad volume evaporated to 10% from 53% in February.
The Conference Board surveys help-wanted advertising volume in 51 major newspapers across the country every month.
The latest help wanted report from the Conference Board is available here.
Help-Wanted Advertising and Job Vacancies from the Federal Reserve Bank of San Francisco can be found here.
| Conference Board | March | Feb | March '04 |
|---|---|---|---|
| National Help Wanted Index | 39 | 41 | 39 |
by Tom Moeller April 28, 2005
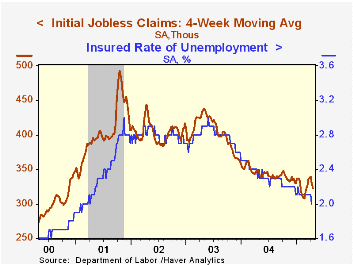
Initial unemployment insurance claims last week recovered 21,000 of the lessened 33,000 decline the prior period. The level of 320,000 equaled Consensus expectations.
During the last ten years there has been a (negative) 75% correlation between the level of initial claims for unemployment insurance and the monthly change in payroll employment. There has been a (negative) 65% correlation with the level of continuing claims.
The four week moving average of initial claims fell sharply to 323,000 (-7.2% y/y).
Continuing claims for unemployment insurance dropped a sharp 76,000 to the lowest level since March of 2001.
The insured unemployment rate slipped to 2.0%.
| Unemployment Insurance (000s) | 04/23/05 | 04/16/05 | Y/Y | 2004 | 2003 | 2002 |
|---|---|---|---|---|---|---|
| Initial Claims | 320 | 299 | -5.9% | 343 | 402 | 404 |
| Continuing Claims | -- | 2,555 | -15.1% | 2,926 | 3,531 | 3,570 |
by Carol Stone April 28, 2005
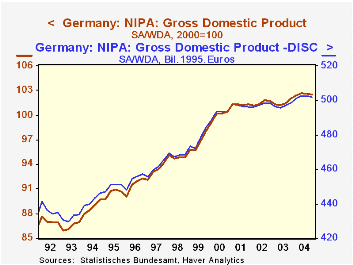
Germany's Federal Statistical Office today introduced its new chain-weighted GDP data with benchmark revisions through Q4 2004. No new periods were published; that will occur for Q1 2005 on May 24.
The chain-linking is calculated on an annual basis, with each line item adjusted by the prices prevailing during the previous year. This is similar to the UK process, but different from the US, which uses the immediate prior quarter. Like the US, though, Germany moved to a reference year in 2000, meaning that price and quantity indexes equal 100 in that year. The fixed-weight base period, most recently 1995, is now obsolete. 2000 is not a "base" year, but the reference year for the index calculations.
With this revision, the German statistics office also introduced other methodological changes. Greater use is made of hedonic pricing, that is, price indices that account for quality changes in goods and services. Newly available service sector statistics are incorporated as well as data from the quadrennial compilation of cost structure information. Finally, "FISIM" data, financial intermediation services indirectly measured, are reorganized according to conventions of the EU statistics regulations.
Interestingly, these various technical changes had only a mild impact on total GDP, which now shows about 0.2% more growth annually than before. In the most recent years, the difference is smaller still, as seen in the table below. Growth in 2004 was virtually the same at 1.6%, according to both methods.
Certainly, some GDP components do show a larger difference. Equipment investment is one of these, as might be expected, with a growth differential averaging about 1.2 percentage points over the last 10 years. Thus, for example, equipment outlays were up 0.9% last year by the new data, but down by 0.2% according to the old calculation scheme. Over the last five or six years, private consumption growth has been nearly the same, but prior to 1998, the chain calculation far outperformed the old fixed-weight regime, so the amount of consumption is larger now than shown before.
As we have noted with other countries as they change this GDP compilation system, the new data don't alter our subjective sense of the economy's health, but they give us a much more solid assessment of it, particularly as spending and production priorities shift around. Sometimes relative pricing is the reason this happens, but other times, technology, demographics and politics are more significant and these forces can push both prices and quantities. So a flexible accounting system gives a better vision of the "big picture" of real growth and inflation, regardless of what year is chosen to be "100".
| Germany | Q4 2004 | Q3 2004 | Q2 2004 | Q1 2004 | 2004 | 2003 | 2002 |
|---|---|---|---|---|---|---|---|
| GDP - New (Bil.Ch.2000 Euros) | 528.27 | 529.00 | 529.20 | 528.12 | 2123.14 | 2090.35 | 2090.30 |
| % Change | -0.1 | -0.0 | 0.2 | 0.4 | 1.6 | 0.0 | 0.2 |
| GDP - Old (Bil.1995 Euros) | 501.60 | 502.77 | 502.66 | 500.89 | 2007.92 | 1987.53 | 1990.27 |
| % Change | -0.2 | 0.0 | 0.4 | 0.5 | 1.6 | -0.1 | 0.1 |
| Equipment Investment - New % Change |
-0.6 | 3.4 | 2.8 | -3.7 | 0.9 | -0.3 | -7.4 |
| Equipment Investment - Old % Change |
-0.4 | 3.4 | 1.9 | -3.9 | -0.2 | -1.5 | -8.5 |

Tom Moeller
AuthorMore in Author Profile »Prior to joining Haver Analytics in 2000, Mr. Moeller worked as the Economist at Chancellor Capital Management from 1985 to 1999. There, he developed comprehensive economic forecasts and interpreted economic data for equity and fixed income portfolio managers. Also at Chancellor, Mr. Moeller worked as an equity analyst and was responsible for researching and rating companies in the economically sensitive automobile and housing industries for investment in Chancellor’s equity portfolio. Prior to joining Chancellor, Mr. Moeller was an Economist at Citibank from 1979 to 1984. He also analyzed pricing behavior in the metals industry for the Council on Wage and Price Stability in Washington, D.C. In 1999, Mr. Moeller received the award for most accurate forecast from the Forecasters' Club of New York. From 1990 to 1992 he was President of the New York Association for Business Economists. Mr. Moeller earned an M.B.A. in Finance from Fordham University, where he graduated in 1987. He holds a Bachelor of Arts in Economics from George Washington University.
More Economy in Brief


