 Global| Jul 09 2018
FIBER: Industrial Commodity Prices Continue to Fall
by:Tom Moeller
|in:Economy in Brief
Summary
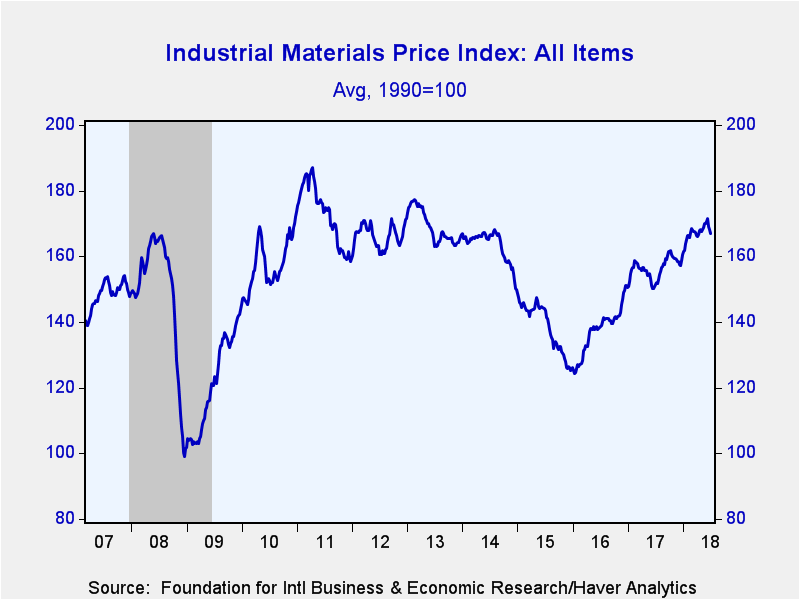
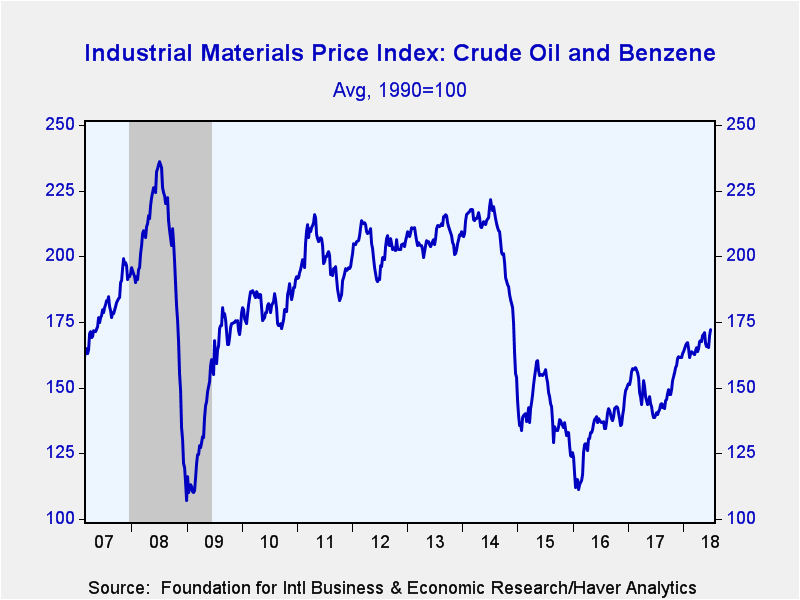
The Industrial Materials Price Index from the Foundation for International Business and Economic Research (FIBER) declined 2.1% during the last month, but rose 9.8% in the last year. It has fallen for three straight weeks. Despite the [...]
The Industrial Materials Price Index from the Foundation for International Business and Economic Research (FIBER) declined 2.1% during the last month, but rose 9.8% in the last year. It has fallen for three straight weeks. Despite the recent shortfall, the index has risen by roughly two-thirds since the January 2016 low.
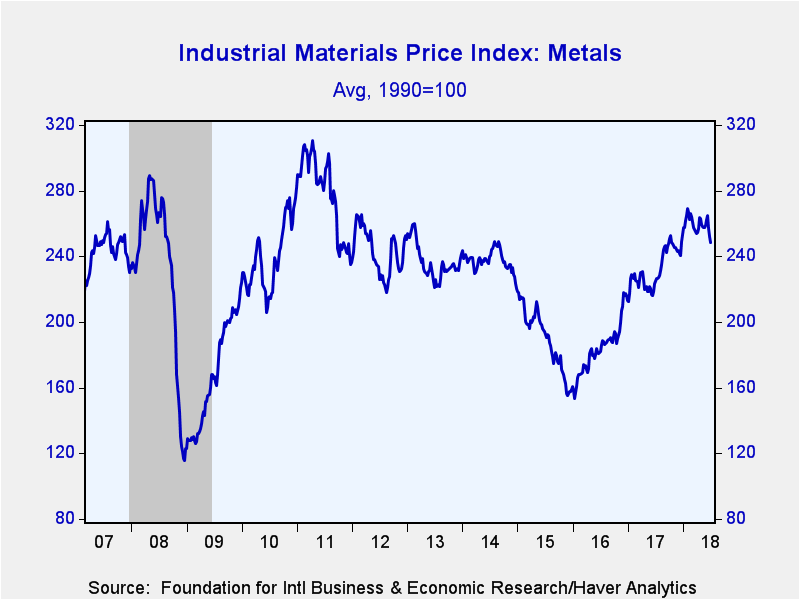
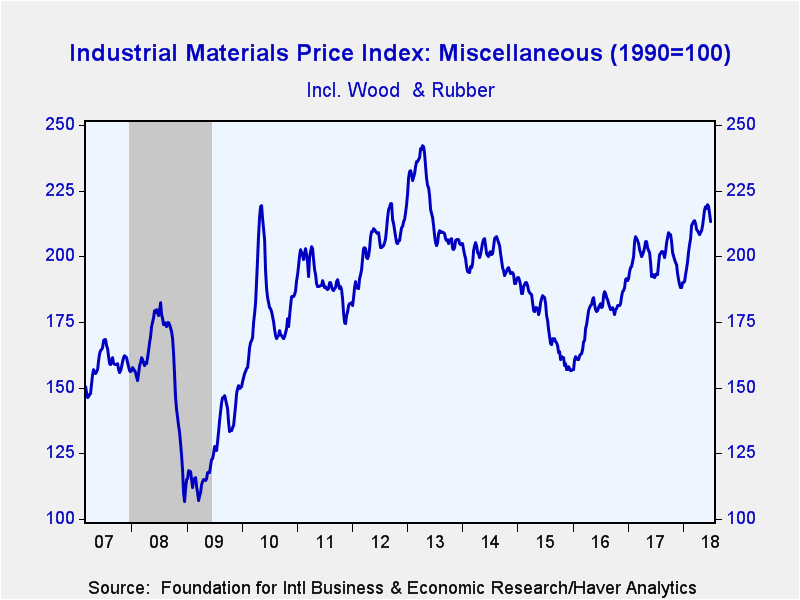
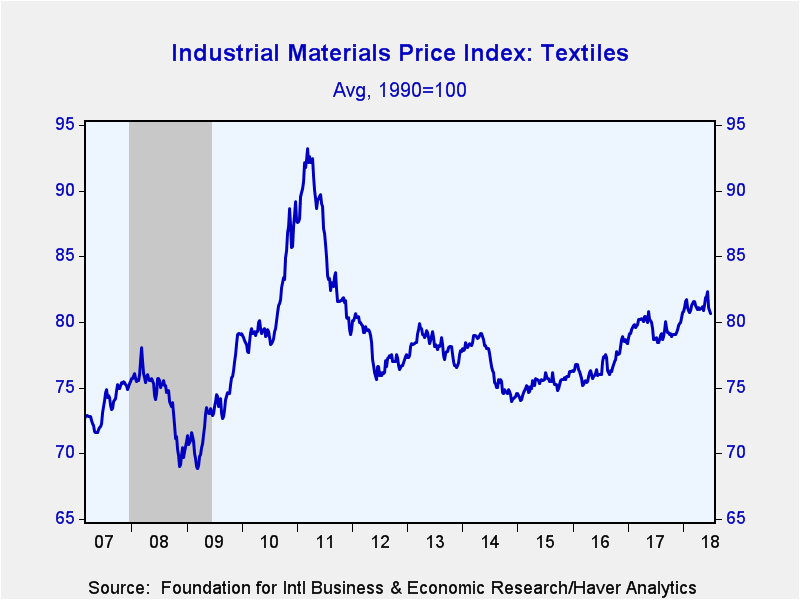
The recent decline was led by a 5.4% m/m drop in metals prices, which remained up by 9.8% y/y. Leading the decline was an 8.9% fall (+3.8% y/y) in zinc prices. Aluminum prices were off 6.7% m/m, but rose 12.5% y/y. Copper scrap prices declined 6.6% m/m (+11.9% y/y) and lead prices fell 3.3% in four weeks (+5.9% y/y). Steel scrap prices declined 2.1% in the last month (+27.4% y/y). Prices in the miscellaneous group fell 2.2% during the last four weeks (+10.3% y/y). Natural rubber prices were off 8.3% in four weeks and were down 6.1% in the last year. Framing lumber prices declined 6.0% last month, up by over one-third y/y. Prices for structural panels were off 3.0% during the last four weeks, but rose 31.7% y/y during the last year. In the textile group, prices overall eased 1.5% last month (+2.3% y/y). Cotton prices declined 8.0% over the last month (+20.1% y/y) while burlap prices fell 2.3% m/m and were down 5.5% during the past year. Offsetting these declines last month was a 3.8% price rise (22.6% y/y) in the crude oil & benzene sector. Crude oil prices rose 12.8% m/m to an average $73.92 per barrel, up by nearly two-thirds y/y. Offsetting that rise were benzene prices which fell 4.1% (+13.9% y/y) in the last four weeks.
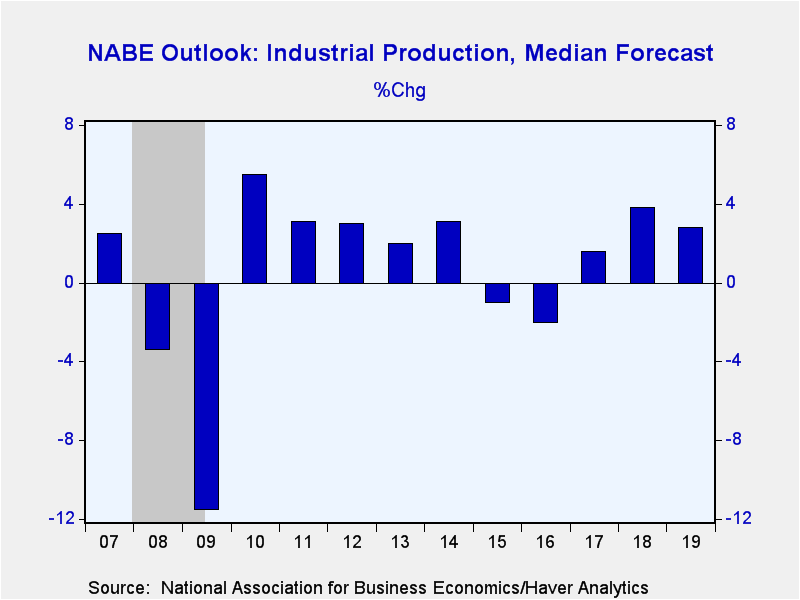
Renewed strength in prices overall may be coming. The consensus forecast for industrial output from the National Association for Business Economics (NABE) calls for a 3.8% rise during all of 2018 and 2.8% growth in 2019. During the last ten years, there has been 50% correlation between the three-month change in prices and the change in U.S. industrial output. In addition, factory sector production in the European Union and Japan continues to improve.
Commodity price data can be found in Haver's DAILY, WEEKLY, USECON and CMDTY databases. The NABE forecast is in the SURVEYS database.
The minutes to the latest FOMC meeting can be found here.
| FIBER Industrial Materials Price Index (%) | 1-Mth | 3-Mth | 6-Mth | 12-Mth | 2017 | 2016 | 2015 |
|---|---|---|---|---|---|---|---|
| All Items | -2.1 | 0.5 | 3.4 | 9.8 | 6.7 | 19.2 | -16.3 |
| Textiles | -1.5 | -0.4 | -0.2 | 2.3 | 3.0 | 2.8 | 2.2 |
| Cotton (cents per pound) | -8.0 | 3.1 | 5.9 | 20.1 | 9.8 | 10.2 | 2.6 |
| Metals | -5.4 | -2.4 | -3.6 | 9.8 | 18.6 | 32.9 | -27.8 |
| Aluminum ($ per metric ton) | -6.7 | 8.4 | -6.8 | 12.5 | 26.0 | 13.0 | -19.2 |
| Copper Scrap (cents per pound) | -6.6 | -2.2 | -8.5 | 11.9 | 29.3 | 17.3 | -27.0 |
| Steel Scrap ($ per ton) | -2.1 | -1.5 | 14.9 | 27.4 | 16.8 | 74.5 | -53.8 |
| Crude Oil & Benzene | 3.8 | 5.0 | 5.1 | 22.6 | 8.1 | 20.4 | -19.4 |
| Crude Oil (WTI, $ per Barrel) | 12.8 | 16.1 | 20.9 | 60.9 | 10.9 | 44.3 | -35.8 |
| Miscellaneous | -2.2 | 1.8 | 12.4 | 10.3 | -0.5 | 21.7 | -18.0 |
| Framing Lumber ($ per 1000 board ft.) | -6.0 | 11.9 | 26.3 | 37.8 | 20.0 | 12.9 | -16.4 |
| Natural Rubber (cents per pound) | -8.3 | -6.3 | -1.3 | -6.1 | -29.6 | 89.4 | -22.5 |
Tom Moeller
AuthorMore in Author Profile »Prior to joining Haver Analytics in 2000, Mr. Moeller worked as the Economist at Chancellor Capital Management from 1985 to 1999. There, he developed comprehensive economic forecasts and interpreted economic data for equity and fixed income portfolio managers. Also at Chancellor, Mr. Moeller worked as an equity analyst and was responsible for researching and rating companies in the economically sensitive automobile and housing industries for investment in Chancellor’s equity portfolio. Prior to joining Chancellor, Mr. Moeller was an Economist at Citibank from 1979 to 1984. He also analyzed pricing behavior in the metals industry for the Council on Wage and Price Stability in Washington, D.C. In 1999, Mr. Moeller received the award for most accurate forecast from the Forecasters' Club of New York. From 1990 to 1992 he was President of the New York Association for Business Economists. Mr. Moeller earned an M.B.A. in Finance from Fordham University, where he graduated in 1987. He holds a Bachelor of Arts in Economics from George Washington University.


