 Global| Sep 23 2009
FHFA Home Price Index StrengthensDue To Notable Gains In The Pacific & Mid-Atlantic Regions
by:Tom Moeller
|in:Economy in Brief
Summary
Released yesterday was the U.S. House Price Index from the Federal Housing and Finance Agency (FHFA). The Purchase Only Index for July rose 0.3% from June and it was the third consecutive monthly increase. Moreover, the latest gain [...]
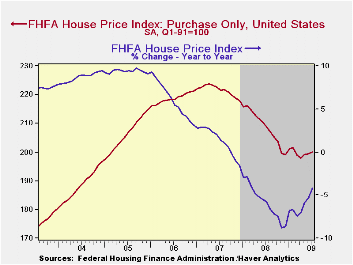
Released yesterday was the U.S. House Price Index from the
Federal Housing and Finance Agency (FHFA). The Purchase Only Index for
July rose 0.3% from June and it was the third consecutive monthly
increase. Moreover, the latest gain eased the year-to-year decline in
the nationwide average of home prices to 4.2% from its worst reading of
negative 8.9% last November. Since their peak in early-2007 home prices
nationwide have fallen 10.5%. The FHFA uses data provided by Fannie Mae
and Freddie Mac and it is not value-weighted.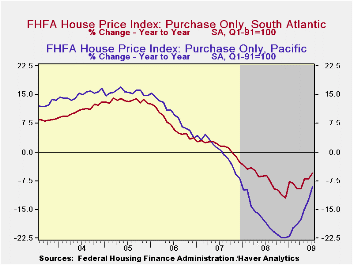
Most notable during July was the 1.6% gain in home prices in the Pacific region of the country. It followed similarly strong 0.7% and 1.6% increases during the prior two months. Nevertheless these increases follow earlier home price declines that were amongst the sharpest in the country. Versus last July prices in the region were still down 9.0% after having fallen 17.3% during all of 2008. Recent improvement in home prices also was evident in a 1.0% July increase in the Mid-Atlantic region. That gain, however, only recouped the decline during June and left prices roughly even with the year-end 2008 level. More moderate monthly gain in home prices were logged in the West North Central, South Atlantic and Mountain Regions of the country. In the latter two regions, however, prices continued notably below the year-ago level.
Continuing weak were home prices in several of the country's regions. Despite a 0.3% July increase, prices in the Mountain states remained off 9.8% from the year ago level and they were off 16.1% from the 2007 peak. In the South Atlantic region prices also posted a gain during July but the 0.6% uptick still left them off by 5.6% from one year ago. Since their early-2007 peak prices here have fallen 12.8%. In the populous East North Central region prices slipped another 0.3% during July and they were flat year-to-date.
Cross-Country Causes and Consequences of the 2008 Crisis: Early Warning Signals from the Federal Reserve Bank of San Francisco can be found here.
| FHFA U.S. House Price Index Purchase Only (%) | July | June | Y/Y | 2008 | 2007 | 2006 |
|---|---|---|---|---|---|---|
| Total | 0.3 | 0.1 | -4.2 | -5.8 | 1.3 | 6.0 |
| New England | -0.1 | 0.3 | -2.5 | -4.6 | -1.7 | 1.1 |
| Middle Atlantic | 1.0 | -1.1 | -2.9 | -2.3 | 1.9 | 6.3 |
| East North Central | -0.3 | -0.2 | -3.3 | -4.4 | -1.3 | 1.8 |
| West North Central | 0.3 | -0.3 | -1.5 | -2.8 | 1.0 | 3.2 |
| South Atlantic | 0.6 | -0.2 | -5.6 | -7.1 | 1.4 | 7.1 |
| East South Central | -0.9 | 2.3 | -1.7 | -1.4 | 3.8 | 7.2 |
| West South Central | -0.2 | 1.1 | 0.1 | 0.7 | 4.7 | 7.2 |
| Mountain | 0.3 | -1.0 | -9.8 | -6.0 | 4.0 | 10.6 |
| Pacific | 1.6 | 0.7 | -9.0 | -17.3 | 0.1 | 9.8 |
by Robert Brusca September 23, 2009
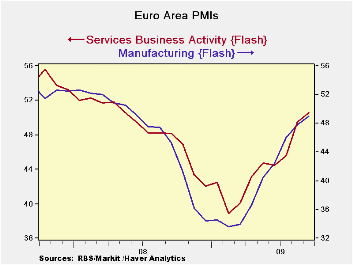
The EMU PMIs are up again – and, for the second month running,
the overall business index is over 50, showing positive growth. The two
main PMI components improved again in September with MFG index up to
40.04 from 48.24 and the services index up to 50.61 from 49.92.
The MFG PMI is at its highest since June of 2008. The services
index is at its best value since April 2008.
The more detailed results show that Germany is suffering some setbacks
and cross currents. That is in-keeping with other German indicators we
have recently seen. In France the improvement continues to move ahead,
with a national index of business sentiment also up sharply in
September.
‘ V-shaped’ recovery -- Europe’s PMIs
continue to sketch out a recovery that is very “V-shaped.’ The MFG PMI
fell from 50 to its cycle low in eight months. Now after eight months
it has risen from its low to 49.04 , nearly back to 50. The Services
PMI slipped to its cycle low in nine months. Now, seven months later,
it is above the neutral mark of 50.
Beyond the diffusion world of the PMIs - Of
course the indices are not yet back to their respective cycle peaks.
But that typically does not happen until the cycle itself actually
peaks which is a long way off (we hope). For now the recovery has been
unfolding apace. The more detailed news from Germany suggests that the
pace of recovery may be in store for some slowing, from a diffusion
standpoint. But there is plenty of room for the expansion to spread in
terms of real readings like orders and industrial output and job
growth, even if the PMIs do not advance very fast from now on. PMIs are
economic indicators; formally, they are measures of breadth- the answer
the question, “what proportion of the industries are doing better, in
terms of jobs, orders, overall performance and so on?” The PMIs do not
answer the question, “how strong is the gain?” That is the next
challenge, to expand the increase in orders and in output that has
begun, and to extend the expansion to include job gains. Then the task
is to continue to show staying power across sectors. Indicators like
the diffusion-based PMIs can be very useful, but they fall short of
giving us the true welfare picture of the economy.
Shifting the focus - For this cycle the PMIs have mostly done
their job. They flagged the slow down and the move lower in the economy
ahead of most traditional economic variables and they also showed the
way for the pick up. Now they will give us some indication of how the
various sectors change speed. But the key reports from here on out will
be the traditional reports that reveal true strength instead of just
diffusion or breadth.
| FLASH Readings | ||
|---|---|---|
| Markit PMIs for the E-Zone | ||
| MFG | Services | |
| Sep-09 | 49.04 | 50.61 |
| Aug-09 | 48.24 | 49.92 |
| Jul-09 | 46.25 | 45.69 |
| Jun-09 | 42.62 | 44.65 |
| Seqment averages | ||
| 3-Mo | 45.70 | 48.57 |
| 6-Mo | 41.43 | 46.34 |
| 12-Mo | 39.34 | 44.31 |
| 127-Mo Range | ||
| High | 60.47 | 62.36 |
| Low | 33.55 | 39.24 |
| % Range | 57.5% | 49.2% |
by Tom Moeller September 23, 2009
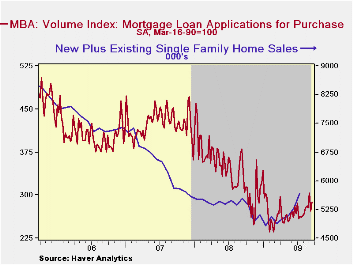
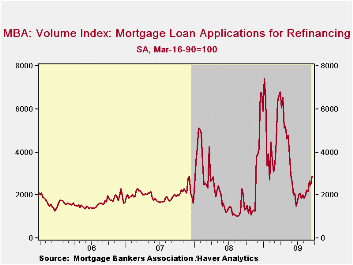
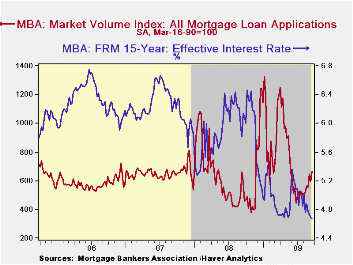 The Mortgage
Bankers Association indicated that mortgage applications overall
increased 12.8% last week as lower interest rates spurred strength in
refinancings. Applications to refinance jumped 17.4% last week and in
September they have risen 29.3% from August. Nevertheless, since their
peak this past January refinance applications have fallen by nearly
two-thirds.
The Mortgage
Bankers Association indicated that mortgage applications overall
increased 12.8% last week as lower interest rates spurred strength in
refinancings. Applications to refinance jumped 17.4% last week and in
September they have risen 29.3% from August. Nevertheless, since their
peak this past January refinance applications have fallen by nearly
two-thirds.
I tandem, there has been lesser strength in purchase applications. Applications rose 5.6% last week and that made up roughly half of the prior week's decline. So far this month purchase applications have risen 4.6% from August after that month's 3.4% increase. Since the early-February low purchase applications have risen 22% as new and existing home sales have recovered. During the last ten years there has been a (negative) 79% correlation between the level of applications for purchase and the effective interest rate on a 30-year mortgage. Moreover, during the last ten years there has been a 61% correlation between the y/y change in purchase applications and the change in new plus existing single family home sales.
 The
effective
interest rate on a conventional 15-year mortgage fell last week to
4.67%, down from the high of 5.21% averaged during June. These figures
are near the lowest since 2003. For a 30-year mortgage the rate also
fell last week to 5.19% after reaching a high of 5.79% in early-June.
Interest rates on 15-year and 30-year mortgages are closely correlated
(>90%) with the rate on 10-year Treasury securities. Rates on
adjustable 1-Year mortgages averaged 6.66% this month versus the low
near 6.0% during January. Nevertheless, the rate remained down from the
7.07% peak reached last fall.
The
effective
interest rate on a conventional 15-year mortgage fell last week to
4.67%, down from the high of 5.21% averaged during June. These figures
are near the lowest since 2003. For a 30-year mortgage the rate also
fell last week to 5.19% after reaching a high of 5.79% in early-June.
Interest rates on 15-year and 30-year mortgages are closely correlated
(>90%) with the rate on 10-year Treasury securities. Rates on
adjustable 1-Year mortgages averaged 6.66% this month versus the low
near 6.0% during January. Nevertheless, the rate remained down from the
7.07% peak reached last fall.
Though they have recovered of late, since the beginning of this year fixed-rate mortgage applications have fallen by slightly more than one-half while adjustable-rate mortgages have more than doubled. The number of conventional loans has fallen nearly two-thirds but gov't backed loans.
 The
Mortgage
Bankers Association surveys between 20 to 35 of the top lenders in the
U.S. housing industry to derive its refinance, purchase and market
indexes. The weekly survey covers roughly 50% of all U.S. residential
mortgage applications processed each week by mortgage banks, commercial
banks and thrifts. Visit the Mortgage Bankers Association site here. The figures for weekly
mortgage applications are available in Haver's SURVEYW
database.
The
Mortgage
Bankers Association surveys between 20 to 35 of the top lenders in the
U.S. housing industry to derive its refinance, purchase and market
indexes. The weekly survey covers roughly 50% of all U.S. residential
mortgage applications processed each week by mortgage banks, commercial
banks and thrifts. Visit the Mortgage Bankers Association site here. The figures for weekly
mortgage applications are available in Haver's SURVEYW
database.
TALF: Jump-Starting the Securitization Markets from the Federal Reserve Bank of Dallas is available here.
| MBA Mortgage Applications (3/16/90=100) | 09/18/09 | 09/11/09 | Y/Y | 2008 | 2007 | 2006 |
|---|---|---|---|---|---|---|
| Total Market Index | 668.5 | 592.8 | 13.0% | 642.9 | 652.6 | 584.2 |
| Purchase | 288.3 | 272.9 | -15.8 | 345.4 | 424.9 | 406.9 |
| Refinancing | 2,881.5 | 2,454.5 | 41.0 | 2,394.1 | 1,997.9 | 1,634.0 |
| 15-Year Effective Interest Rate (%) | 4.7% | 4.7% | 6.1% (9/08) | 5.9% | 6.2% | 6.3% |
by Tom Moeller September 23, 2009
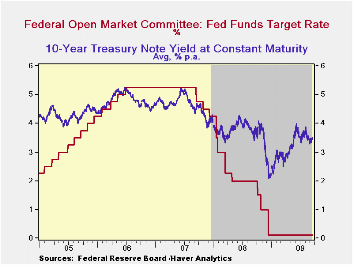
In an anticipated and unanimous vote, the Federal Open Market Committee today left the Federal funds rate in a "range from 0 to 1/4 percent." The discount rate also was left unchanged at 0.5%. The action was as expected and left the Fed funds rate at its lowest level ever.
The Fed indicated that "economic activity has picked up following its severe downturn." In addition, as at earlier meetings, it noted "Although economic activity is likely to remain weak for a time, the Committee anticipates that policy actions to stabilize financial markets and institutions, fiscal and monetary stimulus, and market forces will support a strengthening of economic growth and a gradual return to higher levels of resource utilization in a context of price stability."
Regarding inflation the FOMC statement indicated that "With
substantial resource slack likely to continue to dampen cost pressures
and with longer-term inflation expectations stable, the Committee
expects that inflation will remain subdued for some time."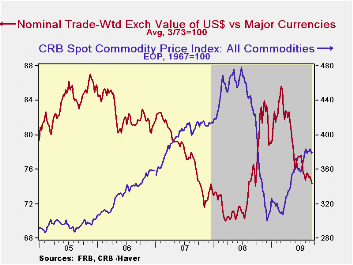
In its effort to promote economic liquidity, the Fed used similar language as in June that "... to provide support to mortgage lending and housing markets and to improve overall conditions in private credit markets, the Federal Reserve will purchase a total of up to $1.25 trillion of agency mortgage-backed securities and up to $200 billion of agency debt by the end of the year. As previously indicated, the Committee indicated that the Federal Reserve’s purchases of $300billion of Treasury securities will be completed by the end of October 2009. Moreover, "The Committee will continue to evaluate the timing and overall amounts of its purchases of securities in light of the evolving economic outlook and conditions in financial markets. The Federal Reserve is monitoring the size and composition of its balance sheet and will make adjustments to its credit and liquidity programs as warranted.
For the complete text of the Fed's latest press release please follow this link.
The Haver databases USECON, WEEKLY and DAILY contain the figures from the Federal Reserve Board.
Against the backdrop of monetary ease, forward indicators are signaling the possibility of future inflationary risk. The CRB Commodity Price Index has risen roughly 25% since yearend while the trade-weighted value of the dollar has fallen 13% since March.
| Current | Last | December | 2008 | 2007 | 2006 | |
|---|---|---|---|---|---|---|
| Federal Funds Rate, % (Target) | 0.00 - 0.25 | 0.00 - 0.25 | 0.16 | 1.93 | 5.02 | 4.96 |
| Discount Rate, % | 0.50 | 0.50 | 0.50 | 2.39 | 5.86 | 5.96 |

Tom Moeller
AuthorMore in Author Profile »Prior to joining Haver Analytics in 2000, Mr. Moeller worked as the Economist at Chancellor Capital Management from 1985 to 1999. There, he developed comprehensive economic forecasts and interpreted economic data for equity and fixed income portfolio managers. Also at Chancellor, Mr. Moeller worked as an equity analyst and was responsible for researching and rating companies in the economically sensitive automobile and housing industries for investment in Chancellor’s equity portfolio. Prior to joining Chancellor, Mr. Moeller was an Economist at Citibank from 1979 to 1984. He also analyzed pricing behavior in the metals industry for the Council on Wage and Price Stability in Washington, D.C. In 1999, Mr. Moeller received the award for most accurate forecast from the Forecasters' Club of New York. From 1990 to 1992 he was President of the New York Association for Business Economists. Mr. Moeller earned an M.B.A. in Finance from Fordham University, where he graduated in 1987. He holds a Bachelor of Arts in Economics from George Washington University.
More Economy in Brief


