 Global| Sep 23 2009
FHFA Home Price Index Strengthens Due To Notable Gains In The Pacific & Mid-Atlantic Regions
by:Tom Moeller
|in:Economy in Brief
Summary
Released yesterday was the U.S. House Price Index from the Federal Housing and Finance Agency (FHFA). The Purchase Only Index for July rose 0.3% from June and it was the third consecutive monthly increase. Moreover, the latest gain [...]
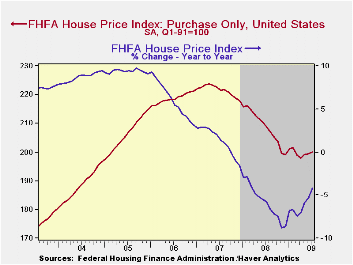
Released yesterday was the U.S. House Price Index from the
Federal Housing and Finance Agency (FHFA). The Purchase Only Index for
July rose 0.3% from June and it was the third consecutive monthly
increase. Moreover, the latest gain eased the year-to-year decline in
the nationwide average of home prices to 4.2% from its worst reading of
negative 8.9% last November. Since their peak in early-2007 home prices
nationwide have fallen 10.5%. The FHFA uses data provided by Fannie Mae
and Freddie Mac and it is not value-weighted.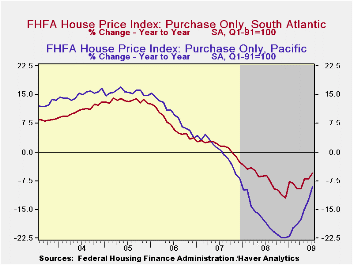
Most notable during July was the 1.6% gain in home prices in the Pacific region of the country. It followed similarly strong 0.7% and 1.6% increases during the prior two months. Nevertheless these increases follow earlier home price declines that were amongst the sharpest in the country. Versus last July prices in the region were still down 9.0% after having fallen 17.3% during all of 2008. Recent improvement in home prices also was evident in a 1.0% July increase in the Mid-Atlantic region. That gain, however, only recouped the decline during June and left prices roughly even with the year-end 2008 level. More moderate monthly gain in home prices were logged in the West North Central, South Atlantic and Mountain Regions of the country. In the latter two regions, however, prices continued notably below the year-ago level.
Continuing weak were home prices in several of the country's regions. Despite a 0.3% July increase, prices in the Mountain states remained off 9.8% from the year ago level and they were off 16.1% from the 2007 peak. In the South Atlantic region prices also posted a gain during July but the 0.6% uptick still left them off by 5.6% from one year ago. Since their early-2007 peak prices here have fallen 12.8%. In the populous East North Central region prices slipped another 0.3% during July and they were flat year-to-date.
Cross-Country Causes and Consequences of the 2008 Crisis: Early Warning Signals from the Federal Reserve Bank of San Francisco can be found here.
| FHFA U.S. House Price Index Purchase Only (%) | July | June | Y/Y | 2008 | 2007 | 2006 |
|---|---|---|---|---|---|---|
| Total | 0.3 | 0.1 | -4.2 | -5.8 | 1.3 | 6.0 |
| New England | -0.1 | 0.3 | -2.5 | -4.6 | -1.7 | 1.1 |
| Middle Atlantic | 1.0 | -1.1 | -2.9 | -2.3 | 1.9 | 6.3 |
| East North Central | -0.3 | -0.2 | -3.3 | -4.4 | -1.3 | 1.8 |
| West North Central | 0.3 | -0.3 | -1.5 | -2.8 | 1.0 | 3.2 |
| South Atlantic | 0.6 | -0.2 | -5.6 | -7.1 | 1.4 | 7.1 |
| East South Central | -0.9 | 2.3 | -1.7 | -1.4 | 3.8 | 7.2 |
| West South Central | -0.2 | 1.1 | 0.1 | 0.7 | 4.7 | 7.2 |
| Mountain | 0.3 | -1.0 | -9.8 | -6.0 | 4.0 | 10.6 |
| Pacific | 1.6 | 0.7 | -9.0 | -17.3 | 0.1 | 9.8 |

Tom Moeller
AuthorMore in Author Profile »Prior to joining Haver Analytics in 2000, Mr. Moeller worked as the Economist at Chancellor Capital Management from 1985 to 1999. There, he developed comprehensive economic forecasts and interpreted economic data for equity and fixed income portfolio managers. Also at Chancellor, Mr. Moeller worked as an equity analyst and was responsible for researching and rating companies in the economically sensitive automobile and housing industries for investment in Chancellor’s equity portfolio. Prior to joining Chancellor, Mr. Moeller was an Economist at Citibank from 1979 to 1984. He also analyzed pricing behavior in the metals industry for the Council on Wage and Price Stability in Washington, D.C. In 1999, Mr. Moeller received the award for most accurate forecast from the Forecasters' Club of New York. From 1990 to 1992 he was President of the New York Association for Business Economists. Mr. Moeller earned an M.B.A. in Finance from Fordham University, where he graduated in 1987. He holds a Bachelor of Arts in Economics from George Washington University.
More Economy in Brief


