 Global| May 22 2007
European Surveys of Business and Consumer Confidence Show Increases in Optimism but Level Remains Subdued
Summary
Among the Euro area analysts and institutional investors surveyed by the Center for European Economic Research (ZEW) in Manheim Germany, the excess of those who feel good about the current situation over those who feel bad rose to an [...]
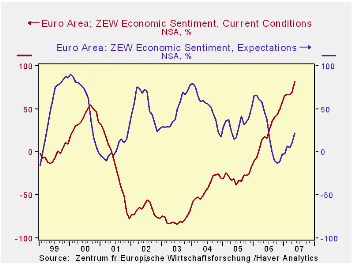
Among the Euro area analysts and institutional investors surveyed by the Center for European Economic Research (ZEW) in Manheim Germany, the excess of those who feel good about the current situation over those who feel bad rose to an all time high of 81.8% in May, an increase of 11.9 percentage points over April, and 63.5 points above May 2006. These same financial types became more optimistic regarding the economic outlook six months ahead. The optimists exceeded the pessimists by 24.0% in May. This is 11.6 percentage points higher than in April, but 26.0 percentage points below May of 2006. In the eight plus years that the data have been available, the level of optimism seems cautious as can be seen in the first chart.
A similar pattern emerges in the ZEW results for Germany alone, as shown in the second chart. An excess of 88% (again an all time high) of the respondents found current conditions good over those who found them bad. This was 11.1 percentage points above April and 79.3 points above May 2006. The excess of optimists over pessimists regarding the economic outlook rose to 24.0% in May, 7.5 percentage points above April, but 26.0 points below May 2006. It is also well below the long term average of expectations in Germany, which is an excess of optimists over pessimists of 33%.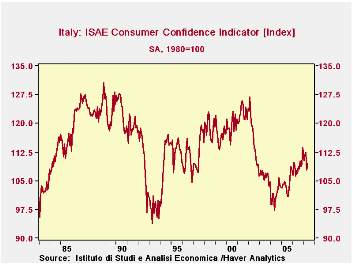
Two indicators of consumer confidence were also released today--one for Italy and one for Turkey. Consumer confidence in Italy, expressed in terms of an index with the base 1980, has increased irregularly since May 2004 as can be seen in the third chart that shows the historical record for this series. The May figure was 109.5 up 1.6 points from April but still well below the previous peaks of 126.9 in February 2002 and 130.7 in November 1988.
The Turkish measure of consumer confidence has four components: Personal Financial Standing, General Economic Situation, Expenditures and Price Expectations. The results of the surveys of these factors are shown as four diffusion indexes. The general index is calculated by taking arithmetic means of the four diffusion indexes. The range of the general index is 0 to 200. If it is above (below)100, it means consumer confidence is optimistic (pessimistic). A value of 100 indicates a neutral position. Data are available only since December 2003. The fourth chart shows that while consumer confidence in Turkey has recovered from a low point reached in July 2006, it is still in pessimistic territory.
| BUSINESS AND CONSUMER CONFIDENCE IN EUROPE | May 07 | Apr 07 | May 06 | M/M Dif | Y/Y Dif | 2006 | 2005 | 2004 |
|---|---|---|---|---|---|---|---|---|
| Euro Area (ZEW) | ||||||||
| Current Conditions % Balance | 81.8 | 69.9 | 18.3 | 11.9 | 63.5 | 23.8 | -28.7 | -41.1 |
| Expectations Six Months Ahead, % Balance |
22.3 | 10.7 | 47.7 | 11.6 | -25.4 | 26.6 | 32.3 | 52.1 |
| Germany (ZEW) | ||||||||
| Current Conditions % Balance | 88.0 | 76.9 | 8.7 | 11.1 | 79.3 | 18.3 | -61.8 | -67.7 |
| Expectations Six Months Ahead, % Balance |
24.0 | 16.5 | 50.0 | 7.5 | -26.0 | 22.3 | 34.8 | 44.6 |
| May 07 | Apr 07 | Mar 07 | Feb 07 | Jan 07 | 2006 | 2005 | 2004 | |
| Italy | ||||||||
| Consumer Confidence (1980=100) | 109.5 | 107.9 | 112.5 | 111.6 | 110.3 | 105.7 | 104.2 | 101.5 |
| Turkey | ||||||||
| Consumer Confidence (Index >100, Optimistic: < 100, Pessimistic: 100=Neutral) |
n.a. | 93.7 | 92.4 | 92.7 | 91.8 | 95.6 | 100.2 | 106.7 |
by Robert Brusca May 22, 2007
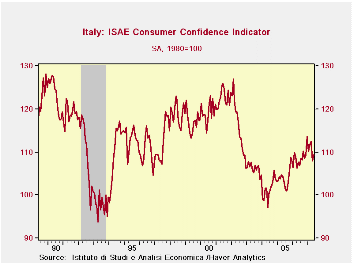
Italy has become EMU’s marginalized large economy. It is the third largest economy in EMU and fourth largest in the EU but it has been struggling of late. The chart shows the ongoing rise in consumer confidence until the start of the New Year when it began to hit some turbulence.
EU/EMU measures continue to be strong to firm. But the rising euro is causing some troubles as are rising energy prices. To some extent the rising euro blunts higher dollar costs for petroleum products. We have yet to see any widespread weakness in trade flows or export orders as a result of euro strength. But since Italy is the weakest of the large EMU economies maybe we should look there first. When we do see we find that the consumer is struggling.
The table below summarizes key responses for the ISAE’s consumer survey. The far right column puts the various May readings in the context of the receptive ranges since 1990. In that context confidence itself is still below the midpoint of that range (at 46%). The overall situation over the past 12 months is not deemed so bad. In fact it is one of the best residing in the 75th percentile of its range. Savings are called the best of the period as consumers have been socking away funds. But the remaining readings are low in the respective ranges. Fear of unemployment is in the 64th percentile - nearly the top third of the range and this is in the Euro area, a place that is supposed to be heating up. Truly Italy is not Germany even though they share a currency.
The overall situation is in the top 72nd percentile of its range for the past 12 months and is in the 27th percentile for the next 12-months. That can’t be a good sign. The consumer evaluates his budget to be in the bottom five percentile over the next 12 months. Italy’s showing signs of weakness. Will those spread to the rest of EMU or is this an isolated problem for Italy?
| Since 1990 | ||||||||
| May-07 | Apr-07 | Mar-07 | 12-MO Avg | AVG | Max | Min | % Range | |
| CONSUMER CONFIDENCE | 109.5 | 107.9 | 112.5 | -110 | -112 | 128 | 94 | 46.3% |
| Last 12-Mos | ||||||||
| Overall Situation | -52 | -55 | -48 | 57 | 67 | -16 | -147 | 72.5% |
| Price Trends | -24.5 | -26.5 | -25.5 | 24 | 16 | 4 | -34 | 25.3% |
| HH Financial Situation | -35 | -38 | -35 | 36 | 27 | 0 | -49 | 28.6% |
| Current | ||||||||
| HH Savings** | 77 | 73 | 69 | -70 | -62 | 77 | 49 | 100.0% |
| Major Purcahses** | 23.5 | 23 | 25.5 | -24 | -28 | 41 | 18 | 26.1% |
| Next 12 Months | ||||||||
| Overall Situation* | -18 | -17 | -10 | 16 | 11 | 24 | -34 | 27.6% |
| Prices Trends | 17.5 | 15.5 | 15.5 | -16 | -24 | 49 | 7 | 25.0% |
| Unemployment | -5 | -5 | -6 | 5 | 5 | 9 | -30 | 64.1% |
| Budget | 3 | 2 | 7 | -8 | -20 | 40 | 1 | 5.1% |
| Purchases planned** | 8.5 | 7.5 | 8 | -10 | -11 | 20 | 4 | 28.1% |
| Future | ||||||||
| Savings** | 26.5 | 23 | 28.5 | -27 | -34 | 44 | 20 | 28.6% |
| * Since Nov 1998, index is More +0.5 'Probable' or +0.5 'same' depending on category | ||||||||
by Robert Brusca May 22, 2007

The Richmond Index rose by one point to a still very weak -10. The chart on the left puts the index in context, plotting the 12-month moving average vs 2-year trailing maximums and minimums, forming a tunnel. At -11 the Richmond MFG index is coming off a 2-year low and has not risen off that low very robustly.
Looking back, the weakness seen in Richmond in the monthly index is similarly to the sort that preceded that last recession. The 12-month average however is not nearly that low. Still the degree of weakness in Richmond MFG is clearly established and is not minor. These are not spike lows, but lows that persist.
The ranges below show that the current MFG readings are quite low in their respective ranges. Among the current readings only wages and prices are above the midpoint in their ranges. The forward-looking indexes show some firmness in jobs hours and prices.
The Richmond services report is substantially stronger. Expected production is very strong. Current readings are firm to strong. The surveys - with or without retailing show that the service sector firmness is widespread. Readings are generally above the midpoints of their ranges. Wage readings are the relative weakest within their ranges. Revenues are firm. Employment is strong. The outlook index is upbeat in stark contrast with conditions in MFG.
| Since Nov 1993 | May-07 | Apr-07 | Percentile of own range | |
| Component | Levels | Levels | Current | 6-mos Ahead |
| Index | -10 | -11 | 30.4% | 36.9% |
| Shipments | -7 | -11 | 32.7% | 37.9% |
| New Order | -13 | -14 | 24.1% | 34.4% |
| backlogs | -18 | -13 | 39.1% | 48.6% |
| Capacity | -17 | 1 | 13.6% | 43.9% |
| Vendor Speed | -1 | -6 | 15.4% | 36.8% |
| Employees | -9 | -14 | 43.6% | 64.3% |
| Workweek | -9 | 12 | 26.8% | 51.2% |
| Wages | 16 | 27 | 69.6% | 29.7% |
| Inventories | ||||
| Finished Goods | 21 | 19 | 42.9% | -- |
| Raw Materials | 12 | 0 | 47.8% | -- |
| Prices Paid | 2.62 | 0.94 | 63.8% | 82.8% |
| Prices Received | 1.5 | 0.94 | 62.7% | 45.0% |
| Capital Expenditures | 16 | 14 | -- | 40.0% |
| Number of | Average | Prod expected next | ||
| Revenues | employees | wage | six months | |
| May-07 | 7 | 9 | 21 | 62 |
| Apr-07 | 5 | 0 | 19 | 80 |
| avg | 10 | 2 | 19 | 33 |
| max | 45 | 20 | 39 | 66 |
| min | -34 | -25 | 3 | 1 |
| %range | 51.9% | 75.6% | 50.0% | 93.8% |
| Richmond Services Excluding Retailing | ||||
| %range | 59.0% | 73.5% | 42.5% | 40.8% |
| Richmond Services - Retail | ||||
| %range | 64.0% | 61.2% | 42.4% | 87.3% |
More Economy in Brief


