 Global| Jan 18 2013
European Orders Continue to Drop
Summary
European manufacturing continues to weaken. The 12 month percentage change in orders is substantially lower for all the countries listed in the table than it was at this time one year ago. . When we compare the year-over-year [...]
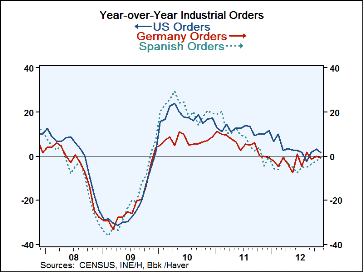
In the month of November among the large emu countries only France has an increase in order month-to-month. Germany posted 2.6% annual rate decline Italy poses 0.5% decline in Spain a 1.3% decline. In the periphery Portugal shows a 3.3% rise. The Netherlands also shows a rise of 2.9%. But by and large, Euro zone continues to demonstrate that it slowing down.
If we look to see how these countries are doing in the context of the current business cycle, Germany and the Netherlands post order levels that are only 11% below their respective past cycle peaks. Italy and Spain and Portugal are closer to 25% below their cycle peaks. France is still below its peak by about 20%.
The quarter to date is marked by declines in Italy, Spain and Portugal. Germany and France are both showing moderate increases in orders (2% to 4%) as of November taking the percentage change over the base of the third quarter. In the Netherlands orders are currently flat with their third quarter level.
The picture gleaned from three month percentage changes in orders is that Europe is still slowing down; in some cases slowing down rather rapidly. However, the quarter-to-date framework which looks at three-month averages over specific quarterly periods is a little bit less dire in its assessment, seeing the weakness as still more concentrated in the peripheral countries. Needless to say circumstances in the zone remain in flux we continue to see weakness in orders and in output with exports weakening pretty much across the board. The purchasing manager framework shows that the slippage on the industrial side is losing pace and that's good news... but the bad news is that the slippage is still there.
| E-Zone EU US Industrial Orders & Sales Trends | |||||||||
|---|---|---|---|---|---|---|---|---|---|
| SAAR ex. pt M/M | % M/M | Nov 2012 |
Nov 2012 |
Nov 2012 |
Nov 2011 |
Nov 2010 |
Q-to-Date | ||
| Ezone Detail | Nov 2012 |
Oct 2012 |
Sep 2012 |
3-Mo | 6-Mo | 12-Mo | 12-Mo | 12-Mo | SAAR |
| Germany | -2.6% | 3.7% | -2.0% | -4.1% | -6.0% | -0.1% | -2.8% | 24.9% | 3.8% |
| France | 0.4% | 1.1% | -2.5% | -4.0% | 0.4% | 0.9% | -0.7% | 19.7% | 2.3% |
| Italy | -0.5% | 0.1% | -4.1% | -16.7% | -7.1% | -6.5% | -0.1% | 11.2% | -12.5% |
| Spain | -1.3% | -1.3% | -3.3% | -21.0% | 6.6% | -0.8% | -0.2% | 7.0% | -7.2% |
| Portugal | 3.3% | -11.2% | 9.7% | 2.6% | 2.6% | -6.3% | -22.7% | 49.8% | -14.2% |
| Finland (NSA) |
8.6% | 6.5% | 5.9% | 125.2% | 21.5% | 2.2% | 1.2% | 21.7% | 135.8% |
| The Netherlands | 2.9% | -4.7% | -0.9% | -11.0% | 0.5% | 3.0% | -3.4% | 12.7% | 0.0% |
| US Factory Orders | 0.0% | 0.8% | 4.5% | 23.2% | -0.2% | 4.2% | 5.1% | 1.3% | 9.8% |
U.S. Consumer Sentiment Becomes More Depressed
by Tom Moeller January 18, 2013
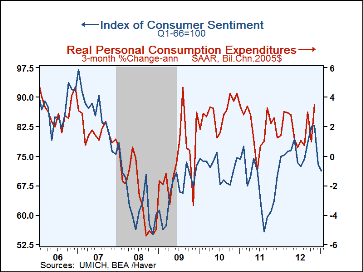
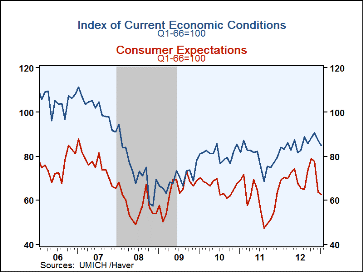
The University of Michigan's Index of Consumer Sentiment for mid-January deteriorated to 71.3 (-4.9% y/y) from an already depressed and unrevised 72.9 in December. The latest figure fell short of Consensus expectations for improvement to 74.0. During the last ten years there has been a 61% correlation between the level of sentiment and the three-month change in real personal consumption expenditures. Both of the index's major components fell last month. The index measuring sentiment regarding current economic conditions fell to 84.8 (+0.7% y/y) and was down just moderately for the last two months. The consumer expectations index fell to 62.7 (-9.3% y/y), down for the third straight month.
The Reuters/University of Michigan survey data are not seasonally adjusted. The readings are based on telephone interviews with over 300 households. Data can be found in Haver's USECON database. The expectations figure is from Action Economics and can be found in Haver's AS1REPNA database.
Persistent Uncertainty for Economic Policymakers from the Federal Reserve Bank of Cleveland is available here.
| University of Michigan (Q1'66 = 100) |
Mid-Jan | Dec | Nov | Jan '12 | 2012 | 2011 | 2010 |
|---|---|---|---|---|---|---|---|
| Consumer Sentiment | 71.3 | 72.9 | 82.7 | 75.0 | 76.5 | 67.3 | 71.8 |
| Current Economic Conditions | 84.8 | 87.0 | 90.6 | 84.2 | 85.6 | 79.1 | 80.9 |
| Consumer Expectations | 62.7 | 63.8 | 77.7 | 69.1 | 70.7 | 59.8 | 66.0 |
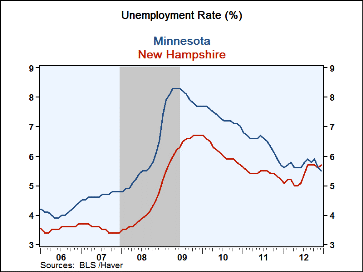
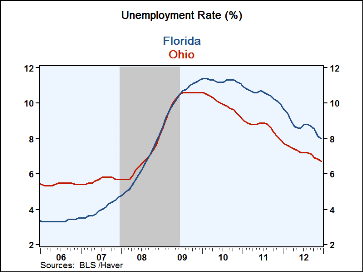
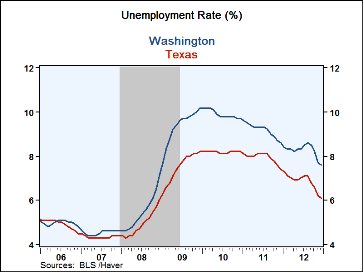
State Unemployment Rates Are Lower But Range From 3.2% To 10.2%
by Tom Moeller January 18, 2013
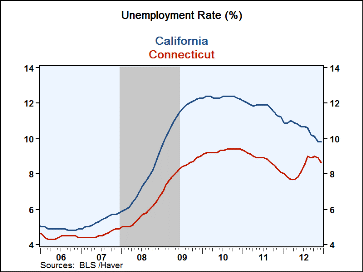
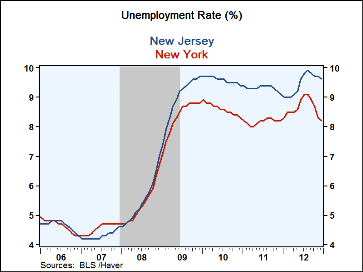
Throughout the United States, the unemployment rate has fallen to some degree from the recession high. While not down much in New Jersey, New York and Connecticut, rates are nonetheless down sharply elsewhere. The problem in the labor market overall, however, is that unemployment rates remain roughly two or more times higher than at their lowest levels in 2007. The accompanying tables indicate the unemployment rates in large and small states.
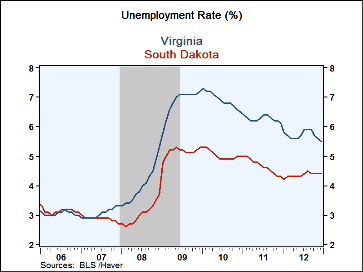
In the two largest states, California and Texas, unemployment rates have declined by roughly two percentage points from their peaks. However, the unemployment rate in California remains one of the highest in the country and nearly four percentage points higher than in Texas. The unemployment rates in the least populated states, including the Dakotas, Nebraska and Iowa, remain the lowest in the country.
Without strong momentum in the country's rate of economic growth, state unemployment rates should remain high and perhaps just as divergent as they are now. The forecast from the National Association for Business Economics is for economic growth of 3.0% or less through the end of this year and an unemployment rate of 7.6% at yearend.
State unemployment figures are available in Haver's EMPLR database.
| State Unemployment Rate | December | November | 2012 | 2011 | 2010 | Labor Force |
|---|---|---|---|---|---|---|
| Total U.S. | 7.8% | 7.8% | 8.1% | 8.9% | 9.6% | 155.1 mil. |
| Ten States With Highest Jobless Rate | ||||||
| Nevada | 10.2 | 10.8 | 11.7 | 13.6 | 13.7 | 1.4 |
| Rhode Island | 10.2 | 10.4 | 10.8 | 11.3 | 11.7 | 0.6 |
| California | 9.8 | 9.8 | 10.5 | 11.8 | 12.3 | 18.4 |
| New Jersey | 9.6 | 9.7 | 9.5 | 9.3 | 9.6 | 4.6 |
| North Carolina | 9.2 | 9.1 | 9.5 | 10.5 | 10.9 | 4.7 |
| Mississippi | 8.6 | 8.5 | 9.0 | 10.7 | 10.5 | 2.3 |
| Georgia | 8.6 | 8.5 | 8.9 | 9.8 | 10.2 | 4.8 |
| Connecticut | 8.6 | 8.9 | 8.3 | 8.8 | 9.3 | 1.9 |
| South Carolina | 8.4 | 8.3 | 9.0 | 10.3 | 11.2 | 2.1 |
| New York | 8.2 | 8.3 | 8.6 | 8.2 | 8.6 | 9.6 |
| States With Lowest Jobless Rate | December | November | 2012 | 2011 | 2010 | Labor Force |
|---|---|---|---|---|---|---|
| Virginia | 5.5% | 5.6% | 5.7% | 6.3% | 6.9% | 4.3 mil. |
| Minnesota | 5.5 | 5.6 | 5.7 | 6.4 | 7.3 | 3.0 |
| New Hampshire | 5.7 | 5.6 | 5.4 | 5.4 | 6.1 | 0.7 |
| Utah | 5.2 | 5.1 | 5.7 | 6.7 | 8.0 | 1.3 |
| Vermont | 5.1 | 5.2 | 5.0 | 5.6 | 6.4 | 0.4 |
| Wyoming | 4.9 | 5.1 | 5.3 | 6.0 | 7.0 | 0.3 |
| Iowa | 4.9 | 4.9 | 5.2 | 5.9 | 6.3 | 1.7 |
| South Dakota | 4.4 | 4.4 | 4.3 | 4.7 | 5.0 | 0.4 |
| Nebraska | 3.7 | 3.7 | 3.9 | 4.4 | 4.7 | 1.0 |
| North Dakota | 3.2 | 3.1 | 3.1 | 3.5 | 3.8 | 0.4 |
| Jobless Rate In Other Selected Large States | December | November | 2012 | 2011 | 2010 | Labor Force |
|---|---|---|---|---|---|---|
| Florida | 8.0% | 8.1% | 8.7% | 10.5% | 11.3% | 9.3 mil. |
| Washington | 7.6 | 7.7 | 8.2 | 9.2 | 9.9 | 3.5 |
| Tennessee | 7.6 | 7.6 | 8.0 | 9.2 | 9.8 | 3.1 |
| Indiana | 8.2 | 8.0 | 8.2 | 9.0 | 10.1 | 3.1 |
| Arizona | 7.9 | 7.8 | 8.3 | 9.5 | 10.5 | 3.0 |
| Colorado | 7.6 | 7.7 | 7.9 | 8.3 | 8.9 | 2.7 |
| Ohio | 6.7 | 6.8 | 7.2 | 8.6 | 10.0 | 5.8 |
| Wisconsin | 6.6 | 6.6 | 6.9 | 7.5 | 8.4 | 3.1 |
| Maryland | 6.6 | 6.6 | 6.7 | 7.1 | 7.8 | 3.1 |
| Texas | 6.1 | 6.2 | 6.8 | 7.9 | 8.2 | 12.6 |
| Louisiana | 5.5 | 5.8 | 6.9 | 7.3 | 7.5 | 2.1 |

Robert Brusca
AuthorMore in Author Profile »Robert A. Brusca is Chief Economist of Fact and Opinion Economics, a consulting firm he founded in Manhattan. He has been an economist on Wall Street for over 25 years. He has visited central banking and large institutional clients in over 30 countries in his career as an economist. Mr. Brusca was a Divisional Research Chief at the Federal Reserve Bank of NY (Chief of the International Financial markets Division), a Fed Watcher at Irving Trust and Chief Economist at Nikko Securities International. He is widely quoted and appears in various media. Mr. Brusca holds an MA and Ph.D. in economics from Michigan State University and a BA in Economics from the University of Michigan. His research pursues his strong interests in non aligned policy economics as well as international economics. FAO Economics’ research targets investors to assist them in making better investment decisions in stocks, bonds and in a variety of international assets. The company does not manage money and has no conflicts in giving economic advice.
More Economy in Brief


