 Global| Jan 11 2013
European IP Still Declines
Summary
The Q4-to-date column (far right in table) is a telling statistic about the condition of Europe. The current level of the respective IP indices as a centered growth rate over the Q3 base shows that IP is declining across all these EU [...]
 The Q4-to-date column (far right in table) is a telling statistic about the condition of Europe. The current level of the respective IP indices as a centered growth rate over the Q3 base shows that IP is declining across all these EU and EMU members alike. Ireland at -33.6% as experiencing the worst crush at the moment while Norway and the Netherlands (-3.6% and -3.7%, respectively) are experiencing the smallest declines.
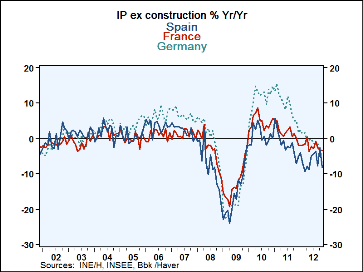
The large core member countries of Germany and France are experiencing output declines at an annual rate of about 15% of Germany and 10% for France. Their rate of descent has 'caught up to' Greece (-15%), Portugal (-13%) and Spain (-12%).
Only three EMU members had month to month increases in IP in November. But the super-sensitive PMI indices are turning a corner and moving higher. Still for EMU we must pay attention to the levels of the PMI indices as they are still showing contraction and this is what we see in the table. In fact ten of eleven of the countries in the table have seen their rate of growth worsen over three months compared to six months. So the rates of growth for IP have not tended to show the softening in the downward pressures yet that are being indicated in the PMIs.
| Assorted e-Zone Countries and EU Members | ||||||||
|---|---|---|---|---|---|---|---|---|
| SAAR except Mo/Mo | Mo/Mo | Nov-12 | Nov-12 | Nov-12 | Oct-12 | |||
| MFG Only | Nov-12 | Oct-12 | Sep-12 | 3-Mo | 6-Mo | 12-Mo | Q4-Date | |
| Germany | 0.4% | -2.0% | -2.0% | -13.9% | -6.4% | -3.3% | -3.8% | -14.8% |
| France | 0.2% | -0.8% | -3.3% | -14.5% | -1.8% | -4.6% | -3.7% | -10.2% |
| Finland | -0.5% | 0.6% | -1.3% | -4.8% | -5.3% | -2.1% | -0.4% | -4.4% |
| Netherlands | 1.2% | -1.4% | -0.1% | -1.1% | 0.7% | 0.4% | -1.7% | -3.7% |
| Spain | -6.3% | 3.8% | -5.6% | -29.1% | -9.7% | -8.1% | -2.8% | -12.3% |
| Ireland | -1.1% | 2.8% | -14.7% | -43.4% | -23.4% | -6.2% | -16.6% | -33.5% |
| Greece | -2.5% | 2.9% | -8.6% | -29.4% | -5.5% | -3.0% | 3.6% | -14.6% |
| Portugal | -3.4% | 5.5% | -12.0% | -35.1% | -7.9% | -4.4% | -3.6% | -13.1% |
| UK: EU Member | -0.4% | -1.2% | 0.0% | -6.4% | -5.6% | -2.1% | -2.0% | -8.6% |
| Sweden | -1.5% | 0.5% | -4.3% | -19.4% | -10.2% | -4.5% | -4.5% | -13.6% |
| Norway | -0.1% | -0.3% | -1.0% | -5.6% | 1.6% | 2.5% | 2.7% | -3.6% |
Robert Brusca
AuthorMore in Author Profile »Robert A. Brusca is Chief Economist of Fact and Opinion Economics, a consulting firm he founded in Manhattan. He has been an economist on Wall Street for over 25 years. He has visited central banking and large institutional clients in over 30 countries in his career as an economist. Mr. Brusca was a Divisional Research Chief at the Federal Reserve Bank of NY (Chief of the International Financial markets Division), a Fed Watcher at Irving Trust and Chief Economist at Nikko Securities International. He is widely quoted and appears in various media. Mr. Brusca holds an MA and Ph.D. in economics from Michigan State University and a BA in Economics from the University of Michigan. His research pursues his strong interests in non aligned policy economics as well as international economics. FAO Economics’ research targets investors to assist them in making better investment decisions in stocks, bonds and in a variety of international assets. The company does not manage money and has no conflicts in giving economic advice.
More Economy in Brief
 Global| Feb 05 2026
Charts of the Week: Balanced Policy, Resilient Data and AI Narratives
by:Andrew Cates


