 Global| Nov 18 2020
Europe's Car Registrations Fall, Rebound...and Lag
Summary
To some, this chart may looks a lot like things are back to normal... but they are not The table below that presents growth rates on several established fixed timelines reveals some of wildness and complexity in evaluating car [...]
 To some, this chart may looks a lot like things are back to normal... but they are not
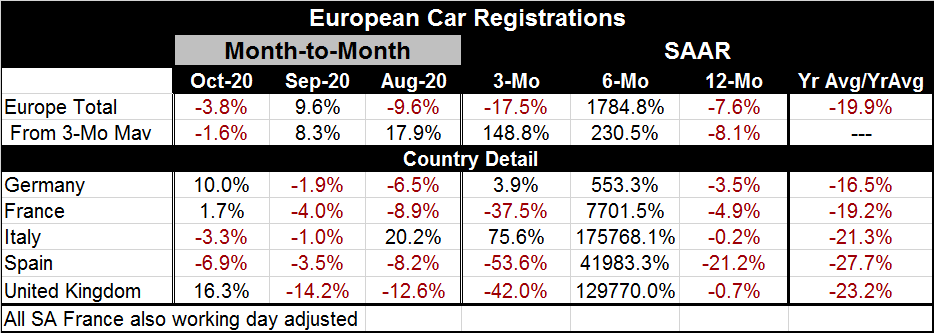
The table below that presents growth rates on several established fixed timelines reveals some of wildness and complexity in evaluating car registration trends in Europe. To take an extreme example, Italian registrations rebounded at a 175-thousand percent annualized rate over six months; yet, they are still are lower by 0.2% year-over-year. And they are ‘only' rising at an annualized rate of 75.6% over three months. That super charged six-month growth rate did not have much in the way of coattails for the three-month growth rate, did it?
Over the most recent three months, registrations are falling - generally at elevated double-digit rates- in three of the five countries listed in the table as well as overall. Only Germany logs anything like a ‘normal' three-month growth rate; all the rest are super-charged double-digit rates whether positive or negative. Germany also has the most ‘modest' six-month growth rate at only 553% annualized. It may be the ‘most modest' but it still is wildly strong.
European registrations are lower by 7.6% year-on-year. Making the same calculation from a three-month average finds them lower by 8.1% year-on-year. The percentage change calculated from the 12-month average vs. the previous 12-month average (Nov 2019-Oct 2020 vs. Nov 2018-Oct 2019) yields a percentage drop of 19.9%. The simple year-on-year percentage change positions current activity compared to one year ago (Oct 2019) before the virus struck. It gives some sense of whether growth is back on track or not. Since these year-on-year changes all are negative, clearly it is not back to normal or to normal plus ‘trend.' But such calculations are not the be-all or end-all of a normalcy litmus test since they ‘leap-frog' over the period of distress.
Beyond auto sales and registrations
If you think of average auto unit sales this point might be easier to understand. Pick a simple arbitrary number for car sales like 15mln units. Suppose sales are at a 15mln unit pace in October 2019 then as the virus hits they drop sharply to 5mln units for two months then rise to 10mln then by October 2020 they are back to 15mln units. In some sense, we are ‘back to normal.' However, the year-to-date average for unit sales will not be recovered. It will be some lower figure. To make up for lost sales, the current results have to overshoot the previous mark of 15mln units for a time to make up for those lost sales during the slump. If that does not happen even if current sales are back to past levels or return to a higher point that only restores them to trend, then the losses remain as losses. In terms of the economy, output will have been lost and incomes will have been lost and in a number of ways the evolution of the economy will be on weaker footing even if ‘the current number' gets back to past notions of normal.
Economists sometimes point out that getting unemployment to its lowest point possible is very important because lost hours worked can never be recouped. A worker who does not work on Monday will forever have that ‘lost output' or foregone-output missing from the economic system. So even as we find economic flows returning to or toward ‘normal' there remains a sense of loss from the virus. This loss can take several forms if government or firms made workers whole for lost wages then that act has either depleted reserves or run up debt. Once economic ‘flows' get back to normal, firms will either find themselves in a weakened financial position or government's with a higher stock of debt or some of both.
In our real world, all of these things have happened and because virus compensation was less than perfect we also have some firms and workers with lots of lost income and some firms are simply out of business. In addition, we have central banks with bloated balance sheets we have lower interest rates and much more government help that must be paid for and yet we are still in the midst of the pandemic. It is not over. It is important to remember the various ways in which the pandemic has weakened the economy and not to be too sure that things are ready to simply snapback to ‘normal.' In various ways, subtle and not so subtle, the virus has had a huge impact on output growth, debt, and central bank balance sheets that has forever changed any notion of ‘normal.'

Robert Brusca
AuthorMore in Author Profile »Robert A. Brusca is Chief Economist of Fact and Opinion Economics, a consulting firm he founded in Manhattan. He has been an economist on Wall Street for over 25 years. He has visited central banking and large institutional clients in over 30 countries in his career as an economist. Mr. Brusca was a Divisional Research Chief at the Federal Reserve Bank of NY (Chief of the International Financial markets Division), a Fed Watcher at Irving Trust and Chief Economist at Nikko Securities International. He is widely quoted and appears in various media. Mr. Brusca holds an MA and Ph.D. in economics from Michigan State University and a BA in Economics from the University of Michigan. His research pursues his strong interests in non aligned policy economics as well as international economics. FAO Economics’ research targets investors to assist them in making better investment decisions in stocks, bonds and in a variety of international assets. The company does not manage money and has no conflicts in giving economic advice.
More Economy in Brief


