 Global| Apr 15 2011
Euro-Area Revises Inflation Is Higher
Summary
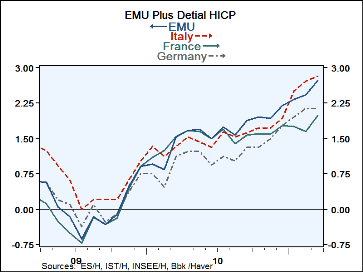
So long as the ECB insists on looking at headline inflation, the picture in the chart above is going to continue to haunt it in its sleep. While headline inflation is ‘raging’ that has almost nothing to do with monetary policy. [...]
 So long as the ECB insists on looking at headline inflation, the picture in the chart above is going to continue to
haunt it in its sleep. While headline inflation is ‘raging’ that has almost nothing to do with monetary policy. Monetary
policy cannot impact severely rising commodity prices except over a period a time. The headline for inflation is going to do
what it is going to do based upon the weights that define it. But when prices rise on items with relatively inelastic demand like
energy and food and some raw materials with no real short term substitutes the situation is exacerbated. To put that toothpaste back in
the tube takes some time. A steady non-accommodative policy can do it or the central bank can be more aggressive and hike rates, as the
ECB has done.
We see this immediately in the table below that shows core inflation across the Zone. In EMU itself core inflation is up only by 1.5% Yr/Yr. That compares to a headline rise of 2.7%, nearly twice as much. With such uneven economic conditions in the Zone, the ECB could have waited to hike rates and had mercy on some of its weaker members but it has chosen not to do that and now a stronger foreign exchange rate for the euro will be another disciplining factor that weak euro-members will have to try to contend with. It’s as though ECB is looking at headline inflation Yr/Yr and core inflation over three-months to see the kind of risk it seems to be responding to.
Year-over-year core trends - As the Core inflation table shows Core inflation is generally much better behaved than the headline and shows a great deal of variability across EMU/EU members. Greece shows none of the weakness in inflation despite the fact that it is one of the weakest EMU nations shows the highest core inflation rate at 2.9% But looks can be deceiving, that inflation rate in Greece has been falling. Its core has been as high as 3.7% back in October and the current 2.9% reflects progress. Portugal has austerity in train and is about to be subjected to more yet its core inflation rate just hopped up to 2.3% from 1.9%. Luxembourg one of the smallest EMU members has shown excess core inflation over the past three months. Ireland another troubled EMU nation has seen negative core inflation for many months but its core rate has been steadily showing less downward pressure. The large economies of France and Germany show core inflation of barely half the ECB’s headline cap-rate with Germany at 1.2% and France at 1%. Spain’s rate has edged up to 1.7%.
Three-month core trends - Spain, Portugal, and Austria show surging rates of Core inflation over three-months. But Spain and Postural are slowing economies. It hardly seems likely that their inflation will continue to run. Greece is almost back under control with its Core HICP up at a 2.1% pace over three-months. Over three-months inflation rates have made appreciable acceleration everywhere in this table except in France, Finland and Germany.
In this presentation it both easy to see what the ECB responded and to see why there were also strong arguments to wait. The US is about on the same inflation curve as Germany for Core inflation but it still lags behind the Zone. With the Fed looking more at the core inflation rate than at the headline rate, and still in an accommodative mood, we may see more dissension in the Fed’s next meeting. Whether the ECB or the US proves to have had the better monetary policy probably will depend on what oil prices do from here forward.
| Trends in HICP | |||||||
|---|---|---|---|---|---|---|---|
| % Mo/Mo | % SAAR | ||||||
| Mar-11 | Feb-11 | Jan-11 | 3-Mo | 6-Mo | 12-Mo | Yr Ago | |
| EMU | 0.8% | 0.2% | 0.1% | 4.6% | 4.0% | 2.7% | 1.5% |
| Core | 0.7% | 0.1% | -0.1% | 2.9% | 1.9% | 1.5% | 1.0% |
| HICP | |||||||
| Germany | 0.5% | 0.3% | 0.1% | 3.7% | 3.9% | 2.3% | 1.2% |
| France | 0.5% | 0.2% | 0.1% | 3.2% | 3.3% | 2.2% | 1.7% |
| Italy | 1.0% | 0.3% | -0.1% | 4.7% | 4.0% | 2.9% | 1.3% |
| Spain | 1.9% | 0.3% | -0.1% | 8.8% | 5.5% | 3.3% | 2.7% |
| Euro-Area & Friends: Core Inflation Yr/Yr and trends | |||||||
|---|---|---|---|---|---|---|---|
| Year/year | Mo/Mo | 3Mo: AR | 6Mo:Ar | ||||
| HICP Core | 1.5% | 1.2% | 1.2% | 0.7% | 0.1% | 2.9% | 1.9% |
| Austria | 2.4% | 2.1% | 1.7% | 0.6% | 0.5% | 5.0% | 3.4% |
| Belgium | 1.9% | 1.7% | 2.1% | 0.4% | -0.4% | 3.2% | 2.3% |
| Finland | 2.2% | 2.0% | 1.6% | 0.2% | 0.4% | 3.1% | 2.9% |
| France | 1.0% | 0.6% | 1.0% | 0.3% | 0.1% | 1.1% | 1.0% |
| Germany | 1.2% | 0.9% | 1.0% | 0.4% | 0.0% | 1.9% | 1.7% |
| Greece | 2.9% | 2.2% | 2.9% | 1.1% | -0.4% | 2.1% | 1.4% |
| Ireland | -0.2% | -0.6% | -1.0% | 0.0% | 0.1% | 1.6% | 0.0% |
| Italy | 2.2% | 1.4% | 1.3% | 1.0% | 0.2% | 3.7% | 2.7% |
| Luxembourg | 2.4% | 2.3% | 2.0% | 0.2% | 0.4% | 3.7% | 2.7% |
| The Netherlands | 1.3% | 1.3% | 1.3% | 0.2% | 0.1% | 2.7% | 2.1% |
| Portugal | 2.3% | 1.9% | 2.2% | 0.5% | -0.2% | 6.0% | 3.3% |
| Spain | 1.7% | 1.6% | 1.4% | 2.1% | 0.1% | 6.4% | 2.1% |
| EU and Other | |||||||
| UK(HICP) | 3.3% | 3.6% | 3.3% | 0.0% | 0.5% | 4.3% | 4.0% |
| USA | 1.2% | 1.1% | 0.9% | 0.1% | 0.2% | 2.0% | 1.4% |
Robert Brusca
AuthorMore in Author Profile »Robert A. Brusca is Chief Economist of Fact and Opinion Economics, a consulting firm he founded in Manhattan. He has been an economist on Wall Street for over 25 years. He has visited central banking and large institutional clients in over 30 countries in his career as an economist. Mr. Brusca was a Divisional Research Chief at the Federal Reserve Bank of NY (Chief of the International Financial markets Division), a Fed Watcher at Irving Trust and Chief Economist at Nikko Securities International. He is widely quoted and appears in various media. Mr. Brusca holds an MA and Ph.D. in economics from Michigan State University and a BA in Economics from the University of Michigan. His research pursues his strong interests in non aligned policy economics as well as international economics. FAO Economics’ research targets investors to assist them in making better investment decisions in stocks, bonds and in a variety of international assets. The company does not manage money and has no conflicts in giving economic advice.


