 Global| Aug 12 2010
Euro-Area IP Takes A Dive
Summary
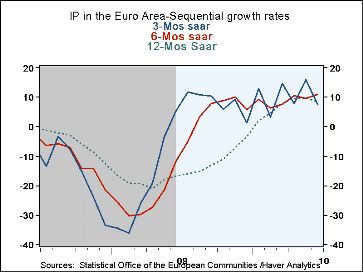
Euro-Area IP ending a period of acceleration? Euro-Area IP is not exactly sputtering but it is stabilizing and showing signs of settling into a lower perhaps sustainable growth path. The three month growth rate has been jerking around [...]
 Euro-Area IP ending a period of acceleration? Euro-Area IP is not exactly sputtering but it is stabilizing and showing signs of settling into a lower perhaps sustainable growth path. The three month growth rate has been jerking around the growth rates of the Yr/Yr trend and the six month trend for months now. The six month growth rate has edged lower while the Yr/Yr rate has perked up slightly. Meanwhile, both the three-month and the six-month rates of growth are below the Yr/Yr pace signaling that a deceleration is overdue in the Yr/Yr pace.
Trends in IP - The month–to-month MFG IP headline has fallen into negative territory for the first time in eight months. Yr/Yr MFG IP is up for six months in a row. The situation for MFG in the Zone is looking pretty good right about now. Still, MFG IP is about 15% below its cycle high. While it has rebounded smartly, by about 9.5% from its cycle low, there is still a lot of ground to cover to get back to fully utilized operating rates.
Nearly all sectors weaken in June- The table shows that in June all main sectors saw a drop in output except for capital goods where output rose by 0.2%. Still over three-months all sectors are expanding except for consumer nondurables and that weakness also makes overall consumer output a negative for three-months
Weakness spreads across many large economies - Of the five large EU economies we look at in the table only two, the UK and Italy have output increases in June. Over three-months the European trend is carried a bit more by its strongest economies as only Germany and Italy, both with outsized gains, have MFG output gains among these five but that is enough to help carry an increase of the Zone as a whole.
Solid quarterly growth but with internal lapses - For the current quarter, just completed with this month’s data output is rising at an 8.1% pace. Consumer goods output is barely higher, rising at a 1% pace. Intermediate and capital goods sectors show output growing at a strong 17.9% and 15%, respectively. By country there is also a great deal of variation. German output is up at a torrid 23% annual rate in Q2. Spain has output up at a 14% pace. Italy’s output is rising at a 9% pace followed by the UK at 6.4% and France at 3.4%.
Is the Euro-Area dodging a slowdown bullet or not? The Euro-Area is still showing strength in its industrial sector. At the same time some of its irregularities are starting to show through as well. Its data do not signal the vulnerability of some of the recent reports from the US but the European reports are about one month or more behind those US reports that have started to send shivers up our spines. It is too soon to say that Europe is weathering a storm to which the US is succumbing. That is especially true since one of the signs US growth is having trouble has come from a fall off in exports and that points to a growth slowdown somewhere. Where?
| Euro-Area MFG IP | ||||||||||
|---|---|---|---|---|---|---|---|---|---|---|
| Saar except m/m | Mo/Mo | Jun 10 |
May 10 |
Jun 10 |
May 10 |
Jun 10 |
May 10 |
|||
| Euro-Area Detail | Jun 10 |
May 10 |
Apr 10 |
3Mo | 3Mo | 6Mo | 6Mo | 12Mo | 12Mo | Q-2 |
| MFG | -0.5% | 0.6% | 0.5% | 2.3% | 11.3% | 9.7% | 11.2% | 8.2% | 9.4% | 8.1% |
| Consumer | -0.2% | 0.9% | -1.3% | -2.3% | 4.7% | 4.2% | 5.6% | 3.4% | 4.1% | 1.0% |
| C-Durables | -0.9% | 3.2% | -0.3% | 8.5% | 14.2% | 9.6% | 5.0% | 7.7% | 6.3% | |
| C-Non-durables | -0.1% | 0.7% | -1.3% | -3.1% | 4.4% | 4.0% | 5.4% | 2.9% | 3.8% | |
| Intermediate | -0.6% | 0.8% | 2.1% | 9.3% | 23.3% | 15.8% | 11.5% | 11.8% | 14.6% | 17.9% |
| Capital | 0.2% | 1.4% | 1.7% | 13.8% | 21.7% | 15.1% | 9.9% | 8.5% | 8.9% | 15.0% |
| Main Euro-Area Countries and UK IP in MFG | ||||||||||
| Mo/Mo | Jun 10 |
May 10 |
Jun 10 |
May 10 |
Jun 10 |
May 10 |
||||
| MFG Only | Jun 10 |
May 10 |
Apr 10 |
3Mo | 3Mo | 6Mo | 6Mo | 12Mo | 12Mo | Q:2 Date |
| Germany: | -0.8% | 3.2% | 1.1% | 15.1% | 36.1% | 18.0% | 17.4% | 11.8% | 13.4% | 23.2% |
| France: IPxConstruct'n |
-1.7% | 1.9% | -0.4% | -1.3% | 9.6% | 5.2% | 8.0% | 5.7% | 8.5% | 3.4% |
| Italy | 0.6% | 1.3% | 0.9% | 11.6% | 9.6% | 10.2% | 7.7% | 8.5% | 7.4% | 9.0% |
| Spain | -1.1% | 1.7% | -1.3% | -2.8% | 24.1% | 5.2% | 6.1% | 3.2% | 5.7% | 14.2% |
| UK: EU member | 0.3% | 0.3% | -0.8% | -0.4% | 7.4% | 5.5% | 6.0% | 4.1% | 4.3% | 6.4% |
Robert Brusca
AuthorMore in Author Profile »Robert A. Brusca is Chief Economist of Fact and Opinion Economics, a consulting firm he founded in Manhattan. He has been an economist on Wall Street for over 25 years. He has visited central banking and large institutional clients in over 30 countries in his career as an economist. Mr. Brusca was a Divisional Research Chief at the Federal Reserve Bank of NY (Chief of the International Financial markets Division), a Fed Watcher at Irving Trust and Chief Economist at Nikko Securities International. He is widely quoted and appears in various media. Mr. Brusca holds an MA and Ph.D. in economics from Michigan State University and a BA in Economics from the University of Michigan. His research pursues his strong interests in non aligned policy economics as well as international economics. FAO Economics’ research targets investors to assist them in making better investment decisions in stocks, bonds and in a variety of international assets. The company does not manage money and has no conflicts in giving economic advice.


