 Global| Jun 29 2007
EU Sentiment Reading is Strong in June at 114.9 but Off from 115.0 in May
Summary
The EU sentiment reading is strong in June at 114.9 but off from 115.0 in May. The accompanying charts plot the main component indicators for EU. Construction seems already to have hit a peak since it has been moving sideways for a [...]
The EU sentiment reading is strong in June at 114.9 but off from 115.0 in May.
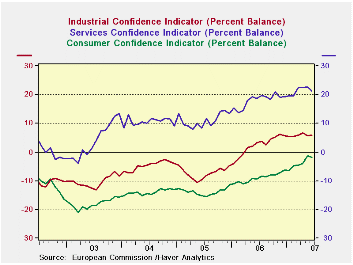
The accompanying charts plot the main component indicators for EU. Construction seems already to have hit a peak since it has been moving sideways for a number of months after peaking in September of 2006. Retail reached a reading of 5 in November 2006 and since has peaked at 6 in April. It is off in May and June. Clearly retailing is another sector that has lost the thrust of upward momentum. The services sector is a bit harder to read. It has backtracked in June but the series seems, other than that, to be in an uptrend but one that has lost a good degree of its up thrust. Consumer confidence spurted in May but has taken a strong setback in June. It’s too soon to read anything into that. The industrial sector is one clear bright spot for the EU region. It is moving up at what has been a slower but unrelenting pace since roughly April of 2006 after a period of much more rapid growth.
The table below provides some specifics on the indexes and their trends plus some country detail as to overall sentiment. First note that among the various EU indexes only the industrial sector is at its top reading. Retail is also strong in its 92nd percentile and construction, while flat for months, is in its 96th percentile. The consumer is lagging with an index that is only in its 86th percentile and services in the top 30 percentile of its somewhat shorter range. Clearly we are assessing different things here. The percentiles speak of the absolute strength of the sector relative to past readings. In the graphs we looked more at momentum, whether sectors are advancing or advancing as strongly as they had been. Both concepts are valid.

In the country section we look at the changes in recent sentiment readings m/m as well as the position of index levels relative to history. All key EMU countries have showed some waffling for their overall sentiment sometime within the past three months. But only the UK is on a two month back-to-back string of very strong increases. Italy has seen its sentiment fall for three months in a row. France, Germany and EMU are experiencing single month declines in overall sentiment. None of the key countries is experiencing super strong levels in sentiment since most are only in about the top 25 percentile of their respective country ranges. Spain is weaker as it is only in the top 40% of its range. Among the largest countries France is doing better, in the top 14 percentile of its range; Germany is in the top 23rd percentile. Overall the EU/EMU readings are stronger, in the 87th percentile, implying that the smaller countries of EMU must be doing relatively better.
There is evidence of a loss in momentum in EU/EMU. But the industrial sector is still very strong.
A similar table with values for the EMU industrial sector shows surprisingly that the relatively strongest component for industry across EMU is export orders – despite the relatively strong value for the euro. Order value is strong overall. But production expectations and selling price expectations are relatively weaker with prices only in the top third of their range and expected production in the top 18 percentile of its range. These are not weak showings, it’s just that they are showings that are weaker than other MFG components and they may be ‘telling us something’, especially as they are explicitly forward-looking.
As for countries, Germany and the UK (the later, an EU member not an EMU member) have the strongest industrial readings relative to their own history. France and Italy are lagging to some extent.
EMU industrial components by and large saw their momentum peak in June of 2006 (Yr/Yr gain) and have been losing momentum ever since. For example, industry confidence had gained 13 points Yr/Yr back in June of 2006; in June of 2007 its Yr/Yr gain is +3. The same is true for countries with the notable exception of non-EMU member UK whose 17 point gain Yr/Yr in June of 2007 for industrial confidence represents acceleration and it matches its current cycle peak of 17 made in February of this year.
| EU | Jun-07 | May-07 | Apr-07 | Mar-07 | Percentile | Rank | Max | Min | Range | Mean | w/Confid |
| Overall | 114.9 | 115 | 113.6 | 113.8 | 95.4 | 6 | 117 | 74 | 43 | 100 | 1.00 |
| Industrial | 7 | 6 | 6 | 6 | 100.0 | 1 | 7 | -27 | 34 | -7 | 0.89 |
| Consumer Confidence | -2 | -1 | -4 | -4 | 86.2 | 18 | 2 | -27 | 29 | -11 | 0.81 |
| Retail | 4 | 5 | 6 | 4 | 92.6 | 4 | 6 | -21 | 27 | -6 | 0.46 |
| Construction | 1 | 1 | 1 | 1 | 95.6 | 6 | 3 | -42 | 45 | -18 | 0.43 |
| Services | 21 | 23 | 22 | 22 | 71.1 | 55 | 32 | -6 | 38 | 17 | 0.80 |
| % m/m | Based on Level | Level | |||||||||
| EMU | -0.4% | 1.0% | -0.1% | 1.3% | 87.0 | 21 | 117 | 74 | 44 | 100 | 0.94 |
| Germany | -0.4% | 0.8% | 1.3% | 1.4% | 77.5 | 17 | 121 | 79 | 42 | 100 | 0.60 |
| France | -0.1% | 3.0% | 0.1% | 0.6% | 86.1 | 18 | 119 | 72 | 47 | 100 | 0.79 |
| Italy | -1.3% | -1.4% | -1.0% | 1.1% | 72.0 | 58 | 121 | 72 | 49 | 100 | 0.80 |
| Spain | 1.2% | -1.2% | -2.2% | 1.1% | 61.9 | 138 | 118 | 67 | 50 | 100 | 0.68 |
| Memo: UK | 1.6% | 3.4% | -0.8% | 1.5% | 93.7 | 5 | 119 | 69 | 50 | 100 | 0.36 |
| Since 1990 except Services (Oct 1996) 208 | -Count | Services: | 126 | -Count | |||||||
| Sentiment is an index, sector readings are net balance diffusion measures | |||||||||||
| EMU | Jun-07 | May-07 | Apr-07 | Mar-07 | Percentile | Rank | Max | Min | Range | Mean | w/Confid |
| Industry Confidence | 6 | 6 | 7 | 6 | 97.3 | 2 | 7 | -30 | 37 | -7 | 1.00 |
| Prod Expectations | 15 | 14 | 15 | 14 | 82.5 | 16 | 22 | -18 | 40 | 6 | 0.90 |
| Order Volume | 7 | 8 | 9 | 8 | 96.8 | 5 | 9 | -54 | 63 | -17 | 0.96 |
| Stocks (finished) | 4 | 5 | 4 | 4 | 9.5 | 186 | 23 | 2 | 21 | 10 | 0.91 |
| Export Order (Vol) | 5 | 6 | 5 | 5 | 98.2 | 2 | 6 | -51 | 57 | -19 | 0.90 |
| Selling Prod Expectations | 14 | 12 | 11 | 13 | 66.7 | 27 | 26 | -10 | 36 | 6 | 0.37 |
| Prod Trend (recent) | 13 | 13 | 14 | 12 | 93.5 | 7 | 15 | -16 | 31 | 1 | 0.92 |
| Employment Expect | 3 | 3 | 2 | 2 | 95.8 | 4 | 4 | -20 | 24 | -9 | 0.80 |
| Sentiment: | Level | Based on Level | Level | w/EMU | |||||||
| Germany | 9 | 9 | 9 | 9 | 95.7 | 6 | 11 | -35 | 46 | -10 | 0.79 |
| France | 2 | 0 | 2 | 2 | 76.8 | 40 | 15 | -41 | 56 | -8 | 0.82 |
| Italy | 5 | 6 | 8 | 5 | 77.1 | 34 | 13 | -22 | 35 | -3 | 0.78 |
| Spain | 0 | 0 | 2 | 3 | 86.3 | 44 | 7 | -44 | 51 | -8 | 0.65 |
| UK | 10 | 4 | 2 | 4 | 98.0 | 2 | 11 | -40 | 51 | -11 | 0.17 |
| Since 1990 | 208 | -Count | |||||||||

Robert Brusca
AuthorMore in Author Profile »Robert A. Brusca is Chief Economist of Fact and Opinion Economics, a consulting firm he founded in Manhattan. He has been an economist on Wall Street for over 25 years. He has visited central banking and large institutional clients in over 30 countries in his career as an economist. Mr. Brusca was a Divisional Research Chief at the Federal Reserve Bank of NY (Chief of the International Financial markets Division), a Fed Watcher at Irving Trust and Chief Economist at Nikko Securities International. He is widely quoted and appears in various media. Mr. Brusca holds an MA and Ph.D. in economics from Michigan State University and a BA in Economics from the University of Michigan. His research pursues his strong interests in non aligned policy economics as well as international economics. FAO Economics’ research targets investors to assist them in making better investment decisions in stocks, bonds and in a variety of international assets. The company does not manage money and has no conflicts in giving economic advice.
More Economy in Brief


