 Global| Oct 22 2009
EMU Trade Surplus Shrinks
Summary
The EMU surplus in trade shrank in August at exports fell a sharp 5.8% in the month and imports skittered lower by 1.3%. While exports are down by a heft 22.8% Yr/Yr their annual rate of decline is cut to the 3% to 4% range over three [...]
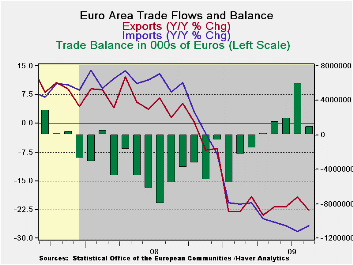
The EMU surplus in trade shrank in August at exports fell a
sharp 5.8% in the month and imports skittered lower by 1.3%. While
exports are down by a heft 22.8% Yr/Yr their annual rate of decline is
cut to the 3% to 4% range over three and six months. While that is a
sharp improvement but it still is not growth. Imports are off by
26.&% Yr/Yr and at a -9.7% pace over six months but over three
months imports are barely lower falling at an annualized rate of -0.8%.
It is too soon to make anything of significance out of these
differences in growth rates. Italy, however, has seen its exports to
China drop with the sharpest drop in exports to Russia, the US, and
OPEC countries. Timely data on the geography of exports is spotty. But
we have seen Italy and Germany report some irregular export and export
orders figures recently. In August exports were down across the board
in EMU. Few categories show anything but continued deceleration from
6-months to three months although the progress compared to Yr/Yr rates
of growth is obvious and very strong. Imports show a clearer, steadier,
more widespread picture of growth rates that are cutting their pace of
decline.
On balance trade is not the clear homerun it had appeared to
be early in the cycle. Some irregularities are cropping up in trade
flows and in measures of international export orders.
| E-zone Trade trends for goods | ||||||
|---|---|---|---|---|---|---|
| m/m% | % Saar | |||||
| Aug-09 | Jul-09 | 3M | 6M | 12M | 12M Ago | |
| Balance* | €€ 995 | €€ 6,000 | €€ (6,370) | €€ 1,505 | €€ (2,779) | €€ 1,666 |
| Exports | ||||||
| All Exp | -5.8% | 4.7% | -2.9% | -3.8% | -22.8% | 1.5% |
| Food and Drinks | -6.5% | 3.4% | -10.4% | -5.0% | -12.2% | 2.1% |
| Raw materials | -6.1% | 6.0% | -3.5% | 27.3% | -21.5% | 7.1% |
| Other | -5.8% | 4.8% | -2.2% | -4.3% | -23.5% | 1.4% |
| MFG | -8.9% | 8.2% | -11.8% | -8.6% | -25.3% | -1.8% |
| IMPORTS | ||||||
| All IMP | -1.3% | 0.8% | -0.8% | -9.7% | -26.7% | 8.3% |
| Food and Drinks | -5.1% | 1.1% | -17.9% | -13.8% | -13.9% | 8.6% |
| Raw materials | 1.2% | 2.1% | 16.6% | -12.4% | -39.5% | 8.0% |
| Other | -1.1% | 0.7% | -0.1% | -9.3% | -26.8% | 8.3% |
| MFG | -1.8% | 0.6% | -10.8% | -12.1% | -23.5% | -2.3% |
| *Eur mlns; mo or period average | ||||||

Robert Brusca
AuthorMore in Author Profile »Robert A. Brusca is Chief Economist of Fact and Opinion Economics, a consulting firm he founded in Manhattan. He has been an economist on Wall Street for over 25 years. He has visited central banking and large institutional clients in over 30 countries in his career as an economist. Mr. Brusca was a Divisional Research Chief at the Federal Reserve Bank of NY (Chief of the International Financial markets Division), a Fed Watcher at Irving Trust and Chief Economist at Nikko Securities International. He is widely quoted and appears in various media. Mr. Brusca holds an MA and Ph.D. in economics from Michigan State University and a BA in Economics from the University of Michigan. His research pursues his strong interests in non aligned policy economics as well as international economics. FAO Economics’ research targets investors to assist them in making better investment decisions in stocks, bonds and in a variety of international assets. The company does not manage money and has no conflicts in giving economic advice.
More Economy in Brief


