 Global| Jan 08 2009
EMU is on an All-time Low for Sentiment Manufacturing and Services Plunge
Summary
The table above summaries the overall EU and sector sentiment gauges. In the bottom panel the EMU and country indices are presented. The blue percentile panel presents the raw readings as a percentage in their all range of values. [...]
The table above summaries the overall EU and sector sentiment
gauges. In the bottom panel the EMU and country indices are presented.
The blue percentile panel presents the raw readings as a percentage in
their all range of values. Overall EU and EMU sentiment are on all time
lows: the zero percentile. Most large EU countries are on their worst
ever reading as well – or close to it (France).
The percentage drops in the sentiment reading across countries
are still huge; for EMU as a single entity the drop is 10% in December.
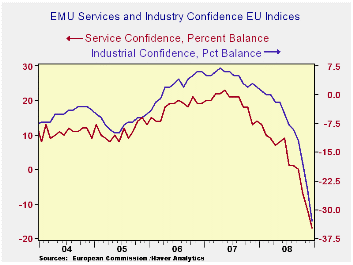
In addition all major sectors are their lows (since 1990) for
the EU. We plot the MFG sector and service sector indices above. Their
paths tell a clear story of how weak things are and that the path lower
still appears to have further downside. There is no deceleration in the
drop or any sense of a bounce.
| EU Sectors and Country level Overall Sentiment | |||||||||||
|---|---|---|---|---|---|---|---|---|---|---|---|
| EU | Dec 08 |
Nov 08 |
Oct 08 |
Sep 08 |
%tile | Rank | Max | Min | Range | Mean | R-SQ w/Overall |
| Overall | 63.5 | 70.5 | 77.2 | 84.9 | 0.0 | 220 | 116 | 64 | 53 | 99 | 1.00 |
| Industrial | -32 | -25 | -19 | -13 | 0.0 | 220 | 7 | -32 | 39 | -7 | 0.87 |
| Consumer Confid | -28 | -24 | -23 | -19 | 0.0 | 220 | 2 | -28 | 30 | -11 | 0.84 |
| Retail | -24 | -18 | -16 | -13 | 0.0 | 220 | 6 | -24 | 30 | -6 | 0.55 |
| Construction | -32 | -29 | -25 | -20 | 22.2 | 185 | 3 | -42 | 45 | -17 | 0.41 |
| Services | -23 | -18 | -10 | -4 | 0.0 | 145 | 32 | -23 | 55 | 16 | 0.84 |
| % m/m | Dec 08 |
Based on Level | Level | ||||||||
| EMU | -10.4% | -6.4% | -8.6% | 67.1 | 0.0 | 220 | 117 | 67 | 50 | 99 | 0.95 |
| Germany | -6.4% | -7.1% | -5.1% | 77.0 | 0.0 | 220 | 121 | 77 | 44 | 99 | 0.64 |
| France | -9.8% | -1.6% | -8.6% | 75.4 | 7.9 | 218 | 119 | 72 | 47 | 99 | 0.79 |
| Italy | -12.2% | -1.5% | -6.9% | 71.0 | 0.0 | 220 | 121 | 71 | 50 | 99 | 0.79 |
| Spain | -10.0% | -4.2% | -5.0% | 57.0 | 0.0 | 220 | 118 | 57 | 61 | 99 | 0.65 |
| Memo: UK | -1.0% | -12.5% | -7.5% | 61.0 | 0.0 | 220 | 118 | 61 | 57 | 99 | 0.48 |
| Since 1990 except Services (Oct 1996) 247 | -Count | Services: | 145 | -Count | |||||||
| Sentiment is an index, sector readings are net balance diffusion measures | |||||||||||

Robert Brusca
AuthorMore in Author Profile »Robert A. Brusca is Chief Economist of Fact and Opinion Economics, a consulting firm he founded in Manhattan. He has been an economist on Wall Street for over 25 years. He has visited central banking and large institutional clients in over 30 countries in his career as an economist. Mr. Brusca was a Divisional Research Chief at the Federal Reserve Bank of NY (Chief of the International Financial markets Division), a Fed Watcher at Irving Trust and Chief Economist at Nikko Securities International. He is widely quoted and appears in various media. Mr. Brusca holds an MA and Ph.D. in economics from Michigan State University and a BA in Economics from the University of Michigan. His research pursues his strong interests in non aligned policy economics as well as international economics. FAO Economics’ research targets investors to assist them in making better investment decisions in stocks, bonds and in a variety of international assets. The company does not manage money and has no conflicts in giving economic advice.
More Economy in Brief


