 Global| Apr 07 2003
ECRI Leading Indicators Tread Water
by:Tom Moeller
|in:Economy in Brief
Summary
The Weekly Leading Index of the US economy published by the Economic Cycle Research Institute (ECRI) fell in the final week of March and the dip left the March average about even with February. Treading water since November, the six- [...]
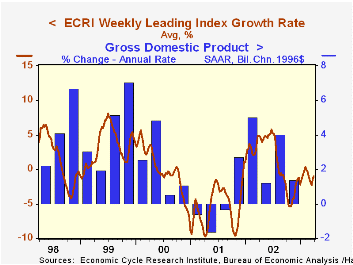
The Weekly Leading Index of the US economy published by the Economic Cycle Research Institute (ECRI) fell in the final week of March and the dip left the March average about even with February.
Treading water since November, the six-month growth rate of the weekly index remained in negative territory where it has been since August. Lower stock prices and higher claims for unemployment insurance have contributed largely to that weakness.
Construction of the ECRI Leading Index differs from the Index of Leading Economic Indicators published by the Conference Board. Nevertheless there has been an 80% correlation between the annual percent change in the two series over the last 20 years.
The components of the weekly index are money supply plus stock & bond mutual funds, the JOC-ECRI industrial materials price index, mortgage applications, bond quality spreads, stock prices, bond yields, and initial jobless insurance claims.
The median lead of the ECRI index at business cycle peaks has been 10.5 months and at cycle troughs 3.0 months. The sideways movement of the leading index in 2002 may or may not signal something about the economy's growth rate.
For more on ECRI and the Weekly Leading Index click here.
| ECRI Leading Index | 3/28/03 | 3/21/03 | Growth Rate | 2002 | 2001 | 2000 |
|---|---|---|---|---|---|---|
| Weekly | 119.2 | 120.5 | -1.0% | 1.1% | -5.2% | 1.0% |
| Mar | Feb | |||||
| Monthly | 118.9 | 118.8 | -0.7% |
by Tom Moeller April 7, 2003
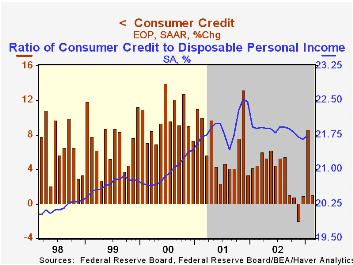
Consumer credit outstanding (which excludes mortgages) rose $1.5B (1.0% AR) in February. Consensus expectations had been for a $3.0B rise. The preliminary report of a $13.2B surge in January was revised slightly lower to a $12.3B rise. Revolving credit usage was revised down but nonrevolving was revised up.
Revolving credit rose 9.0% (AR) following the 5.5% gain in January. These gains follow four consecutive months of decline.
Nonrevolving credit fell at a 4.6% rate following a 10.7% January increase.
In 2002, the amount of consumer credit outstanding was $1,762.3B of which $738.4B was revolving and $1,023.9B was nonrevolving.
| Consumer Credit Outstanding | Feb m/m | Jan m/m | Y/Y | 2002 | 2001 | 2000 |
|---|---|---|---|---|---|---|
| Total | $1.5B | $12.3B | 3.6% | 3.6% | 6.9% | 10.2% |
| Revolving | $5.4B | $3.3B | 2.8% | 1.6% | 5.1% | 11.6% |
| Nonrevolving | $-3.9B | $9.1B | 4.2% | 5.0% | 8.2% | 9.1% |

Tom Moeller
AuthorMore in Author Profile »Prior to joining Haver Analytics in 2000, Mr. Moeller worked as the Economist at Chancellor Capital Management from 1985 to 1999. There, he developed comprehensive economic forecasts and interpreted economic data for equity and fixed income portfolio managers. Also at Chancellor, Mr. Moeller worked as an equity analyst and was responsible for researching and rating companies in the economically sensitive automobile and housing industries for investment in Chancellor’s equity portfolio. Prior to joining Chancellor, Mr. Moeller was an Economist at Citibank from 1979 to 1984. He also analyzed pricing behavior in the metals industry for the Council on Wage and Price Stability in Washington, D.C. In 1999, Mr. Moeller received the award for most accurate forecast from the Forecasters' Club of New York. From 1990 to 1992 he was President of the New York Association for Business Economists. Mr. Moeller earned an M.B.A. in Finance from Fordham University, where he graduated in 1987. He holds a Bachelor of Arts in Economics from George Washington University.


