 Global| Dec 26 2006
Discretionary Consumer Spending Picks Up in US as Energy Outlays Fall
Summary
It seem appropriate on the Day after Christmas to look at consumer spending; last Friday here, Tom Moeller called our attention to the total PCE increase in November of 0.5% in current dollars and also 0.5% in real terms.One of the [...]
It seem appropriate on the Day after Christmas to look at consumer spending; last Friday here, Tom Moeller called our attention to the total PCE increase in November of 0.5% in current dollars and also 0.5% in real terms.One of the aspects of the BEA's monthly data release that has always been fascinating for us is the detail available in the "Underlying Tables", a supplement to the full national accounts; historically these tables were known as "unpublished data", which were available only by phone from BEA or to specific subscribers to these extra tables. Now these are more widely disseminated on the BEA's website and, of course, in Haver's USNA database.All of our following discussion is in nominal terms so we can talk about the percentage distribution, a calculation that is not valid in chain dollar terms.
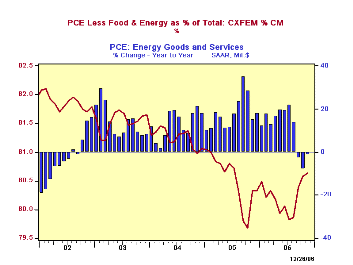
First in the major tables, we can see that energy expenditures are declining: 2.8% in November, the fourth consecutive nominal decrease; they are even below the year-ago period by 1.5%. This carries them down from a peak of 6.5% of total PCE in July to "just" 5.5% last month.
If we also exclude food, so we can look at the so-called "core" items, we see that they have diminished enough to allow non-core spending to increase more. In September, for instance, as total PCE was flat, non-core spending rose 0.6%. In October and November, it also expanded more than the total, so its share has increased to 80.63%, the highest since July 2005. The low this year was 79.82% in July.
What are people doing with their extra "spending money"? More home theater. As seen in the second graph, audio and video equipment outlays have surged over the last three months following a pause from February through August. A further breakdown shows the renewed expansion in TV receivers, audio and video, and a 5% spike in computers in November. Among nondurable goods, spending on toys and flowers began to grow in September as well.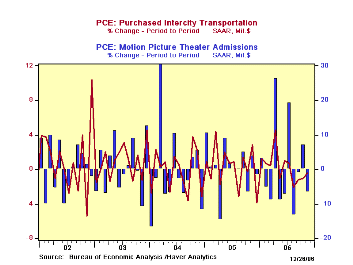
Services saw less pronounced responses; transportation has slowed generally, with modest outright declines in both local and intercity travel. Consumers' medical care expenses show less growth. Recreational services are erratic; movie theater outlays show a seesaw pattern, perhaps corresponding to the release of big-name films (although we couldn't correlate quickly a list of movie releases to the pattern in the BEA figures), but the trend is generally weak. Expenditures on spectator sports are also up-and-down monthly, but show modest growth overall.
Presently, then, it looks that consumers are trying to make their homes more a location of activity and entertainment, with less reliance on energy-involving travel. And perhaps, we can speculate, the availability of home electronics means they are going out less to movies, cultural events and sports. At the same time, the breakdown of the core "food" category does show that people are spending more on "purchased" meals, that is, on eating out, with particularly strong growth in the alcohol component.
| PCE: Select Items, SAAR, Bil.$ |
Nov 2006 | Oct 2006 | Sept 2006 | Nov 2005 | 2005 | 2004 | 2003 |
|---|---|---|---|---|---|---|---|
| Total | 9,425.2 | 9,374.7 | 9,348.5 | 8,916.4 | 8,742.4 | 8,211.5 | 7,703.6 |
| % Change | 0.5 | 0.3 | -0.0 | 5.7 | 6.5 | 6.6 | 4.8 |
| Energy G & S | 515.3 | 530.2 | 551.5 | 523.2 | 501.9 | 425.3 | 376.9 |
| % of Total | 5.5 | 5.7 | 5.9 | 5.9 | 5.7 | 5.2 | 4.9 |
| PCE ex Food & Energy | 7,599.8 | 7,553.8 | 7,515.4 | 7,162.1 | 7,039.1 | 6,671.4 | 6,280.8 |
| % of Total | 80.63 | 80.58 | 80.39 | 80.32 | 80.52 | 81.42 | 81.42 |
| % Change | 0.6 | 0.5 | 0.6 | 6.1 | 5.5 | 6.2 | 4.4 |
Carol Stone, CBE
AuthorMore in Author Profile »Carol Stone, CBE came to Haver Analytics in 2003 following more than 35 years as a financial market economist at major Wall Street financial institutions, most especially Merrill Lynch and Nomura Securities. She had broad experience in analysis and forecasting of flow-of-funds accounts, the federal budget and Federal Reserve operations. At Nomura Securities, among other duties, she developed various indicator forecasting tools and edited a daily global publication produced in London and New York for readers in Tokyo. At Haver Analytics, Carol was a member of the Research Department, aiding database managers with research and documentation efforts, as well as posting commentary on select economic reports. In addition, she conducted Ways-of-the-World, a blog on economic issues for an Episcopal-Church-affiliated website, The Geranium Farm. During her career, Carol served as an officer of the Money Marketeers and the Downtown Economists Club. She had a PhD from NYU's Stern School of Business. She lived in Brooklyn, New York, and had a weekend home on Long Island.
More Economy in Brief


