 Global| Nov 25 2008
Dip in U.S. 3Q'08 GDP Revised Little; Profits Fell (Again)
by:Tom Moeller
|in:Economy in Brief
Summary
U.S. real GDP growth last quarter was little revised at -0.5% due to offsetting revisions to final demand growth (down) and inventories (up). The modest 0.5% (AR) decline compared to the advance report of a 0.3% dip and the revised [...]
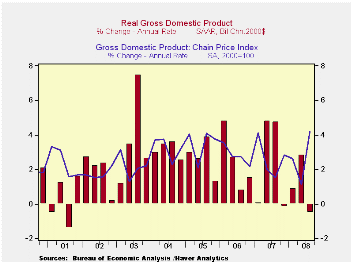
U.S. real GDP growth last quarter was little revised at -0.5% due to offsetting revisions to final demand growth (down) and inventories (up). The modest 0.5% (AR) decline compared to the advance report of a 0.3% dip and the revised figure matched Consensus expectations. Continuing its recent trend, the y/y rate of growth of 0.7% was the weakest since the end of the 2001 recession.
Released for the first time were corporate profits.
They fell 1.0% and were down 9.0% y/y. Last quarter's decline compared
to a 3.8% drop during 2Q and it was the seventh decline of the last
eight quarters. The y/y decline was the weakest since the 2001
recession. The financial sector's travails continued to lead profits
lower. Profits here fell 16.4% (-28.3% y/y) during 3Q. To some extent,
cost cutting amongst domestic nonfinancial corporations offset that
decline in financial sector earnings, but it wasn't by much. Profits in
the domestic nonfinancial sector rose 6.1% during 3Q , but the weaker
economy still left them down 4.8% versus last year. Finally, economic
weakness lowered repatriated foreign sector earnings. They slipped 0.2%
and were down for the third consecutive quarter. For the four quarters
ending in 3Q, however, earnings were still positive, up 4.5%.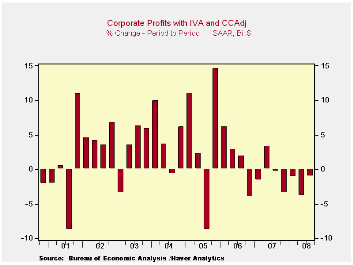
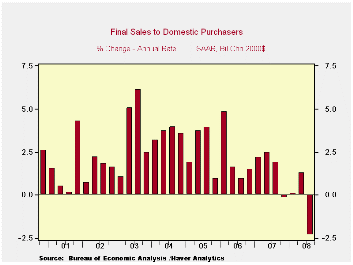
Back in the U.S., real final sales to domestic purchasers remained notably weak in 3Q. The estimate was shaved to a 2.3% annual rate of decline versus the initial figure of a 1.8% drop. It remained the largest quarterly decline since the end of the 1990-91 recession. The year-to-year dip of 0.3%, while still modest, was the first since 1991.
A decline in real PCE subtracted 2.7 percentage points from 3Q real GDP growth after a 0.9 point addition during 2Q. Personal consumption expenditures fell at a 3.7% annual rate (0.0% y/y) versus the initial estimate of a 3.1% fall. The drop followed 1.2% growth during 2Q which presumably was fueled by tax rebate checks but the lift seems to have been slight. Spending on autos & light trucks continued to collapse, down at a 26.4% annual rate (-15.0% y/y). Real spending on furniture & other household equipment fell at an 8.9% rate; Lower prices fueled the positive 2.4% y/y gain in furniture sales; nominal sales were down 1.6% y/y. Real spending on apparel fell at a 13.6% clip (-1.1% y/y) and that more than reversed a 2Q jump. Spending on consumer services was unchanged. The y/y gain of 1.1% in consumer services remained the weakest since 1981.
Residential construction fell again last
quarter and the little revised 17.6% (-20.9% y/y) rate of decline
subtracted 0.7% points from GDP growth.
Business fixed investment was little changed at a -1.5% annual rate (+1.7% y/y), the first decline since the fourth quarter of 2006. It followed 2.5% growth during 2Q, a 4.9% rise during 2007 and roughly 7.5% growth in 2006 and 2005. Equipment investment repeated its 2Q performance and fell at a 5.6% rate (-2.6% y/y), the third consecutive quarter of decline. Conversely, structures investment was firm again and rose at a 6.6% annual rate (10.5% y/y).
Inventory accumulation added a somewhat greater 0.9 percentage points to GDP growth after three consecutive quarters of subtraction.
An improved foreign trade deficit added
the same 1.1 percentage points to U.S. growth as estimated last month
and it remained the main source of lift to GDP growth. The addition
was, however, almost one third of that in 2Q. Exports grew at a slower
3.4% annual rate (6.2% y/y), half that in 2Q. Growth in imports
weakened with the slowdown in overall economic growth. The 3.2% fall
(-3.4% y/y) was the fifth quarterly decline in the last six.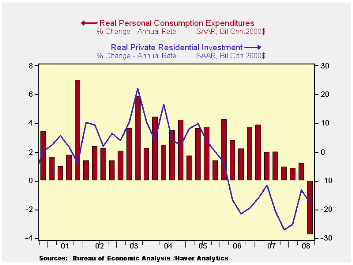
Spending by governments was strong again. The 5.3% rise (3.0% y/y) was little revised but the quickest since early 2003.
The GDP chain price index surged at an unrevised 4.2% annual rate. The accelerated rate of increase owed to a 5.2% jump in the PCE price index which was fueled by higher energy prices. Capital spending prices rose at an accelerated 4.3% rate (2.2% y/y) while the residential investment price deflator declined for the fourth straight quarter (-1.9% y/y).
The Federal Reserve Board on Tuesday announced the creation of the Term Asset-Backed Securities Loan Facility (TALF) and the announcement can be found here.
| Chained 2000$, % AR | 3Q '08 (Preliminary) | 3Q '08 (Advance) | 2Q '08 | 3Q Y/Y | 2007 | 2006 | 2005 |
|---|---|---|---|---|---|---|---|
| GDP | -0.5 | -0.3 | 2.8 | 0.7 | 2.0 | 2.8 | 2.9 |
| Inventory Effect | 0.9 | 0.6 | -1.5 | -0.4 | -0.4 | 0.0 | -0.2 |
| Final Sales | -1.4 | -0.8 | 4.4 | 1.1 | 2.4 | 2.8 | 3.1 |
| Foreign Trade Effect | 1.1 | 1.1 | 2.9 | 1.4 | 0.6 | 0.2 | 0.0 |
| Domestic Final Demand | -2.3 | -1.8 | 1.3 | -0.3 | 1.8 | 2.6 | 3.1 |
| Chained GDP Price Index | 4.2 | 4.2 | 1.1 | 2.7 | 2.7 | 3.2 | 3.3 |
by Tom Moeller November 25, 2008
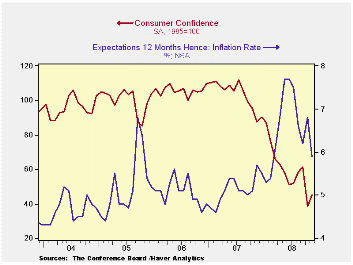
The Conference Board reported that its November index of consumer confidence recovered a small piece of an October collapse. The rise to a level of 44.9 followed an October decline to 38.8. Consensus expectations had been for a roughly unchanged reading of 38.1.
During the last ten years there has been a 79% correlation
between the level of consumer confidence and the y/y change in real
consumer spending.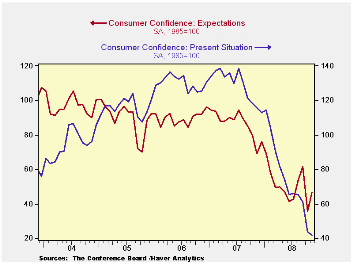
This month's rise reflected a decrease in the percentage of respondents expecting business conditions to worsen in six months. The latest level did, however, remain near the highest since the credit crunch of 1980. A small 11.4% expected improvement in conditions. More jobs were expected by just 9.2% of respondents while a near-record 17.7% foresaw less income.
The present conditions index fell even further to the lowest level since 1992. Jobs were seen as hard to get by 37.2% of respondents, the highest since 1993 and jobs were seen as plentiful by just 8.8%. Business conditions were seen as good by just 9.9%, the lowest since 1991. Those who thought conditions were bad rose to 40.3%, also the highest since 1992.
Expectations for the inflation rate in twelve months fell further 5.9%, the lowest level since February.
The Federal Reserve announced on Tuesday that it will initiate a program to purchase the direct obligations of housing-related government-sponsored enterprises (GSEs). The text of the announcement is available here.
| Conference Board (SA, 1985=100) | November | October | Y/Y % | 2007 | 2006 | 2005 |
|---|---|---|---|---|---|---|
| Consumer Confidence Index | 44.9 | 38.8 | -48.9 | 103.4 | 105.9 | 100.3 |
| Present Situation | 42.2 | 43.5 | -63.5 | 128.8 | 130.2 | 116.1 |
| Expectations | 46.7 | 35.7 | -32.4 | 86.4 | 89.7 | 89.7 |
by Tom Moeller November 25, 2008
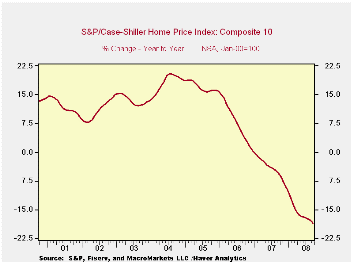
The S&P/Case-Shiller 20 Home Price Composite Index fell another 1.8% during September. Since their peak in July 2006, prices have fallen 22.0% -- down 17.4% during the last twelve months. The series dates back only to 2000. The decline in September prices was greater than generally expected.
The Case-Shiller index of 20 U.S. cities and their surrounding
areas is weighted to reflect price changes due to extensive remodeling,
home additions or extreme neglect. For example, smaller weights are
assigned to sales of homes that have undergone extensive remodeling.
The Case-Shiller composite index of homes in 10 metropolitan areas, which has a longer history and dates back to 1987, fell 1.9% during September. The index was down 18.6% year-to-year and was down 23.4% since the 2006 peak.
Weakest Regions: Home prices in Phoenix, Nevada continued quite weak and fell 3.5% during September (-31.9% y/y) and in San Diego prices fell another 2.4% (-26.3% y/y). Home prices in Las Vegas, Nevada fell 2.6% (-31.3% y/y). Prices in Miami fell 2.6% during September and were off 28.4% y/y, while the same was true for home prices in Los Angeles, down 27.6% y/y. In San Francisco home prices were off 29.5% y/y while prices in Miami fell 28.4%. Florida generally has seen weak home prices and in Tampa they posted a 19.5% y/y decline. The weak auto sector dragged down home prices in Detroit by 18.6% y/y.
Less Weak Regions: In the Northeast, the decline in home prices has been less severe to date. In New York, prices fell a lesser 7.3% y/y and they were down 5.7% in Boston. In Dallas, prices also were off by a modest 2.7% y/y and in Charlotte, North Carolina they fell 3.5% y/y . In Denver, home prices were off 5.4% y/y and they were down 6.4% y/y in Cleveland Ohio. In Chicago, home prices were off 10.1%.
The S&P/Case-Shiller home price series can be found in Haver's USECON database but the city data is in the REGIONAL database.
The latest press release from Standard & Poor's can be found here.
An overview of the S&P/Case-Shiller home price series can be found here.
| S&P/Case-Shiller Home Price Index (NSA, Jan 00 = 100) | September | August | Y/Y | 2007 | 2006 | 2005 |
|---|---|---|---|---|---|---|
| 20 City Composite Index | 161.56 | 164.60 | -17.4% | -3.8% | 7.6% | 15.8% |
by Robert Brusca November 25, 2008
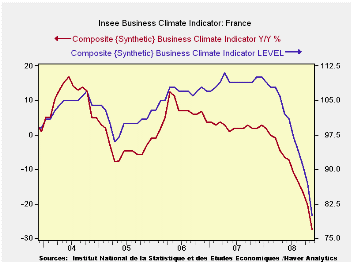
The Insee business climate indicator is plunging. The overall
index dropped to 80 in November from 87 in October and now sits in the
bottom 14% of its range going back to 1990. It is the 10th weakest
climate reading on record. The table below is for the manufacturing
sector which is similarly weak. For manufacturers in France the current
industrial trend is the worst on record. The price level is in the
bottom 16% of its range. The recent trend is weak, bottom 20 percent of
its range. But the outlook trend at a -28 raw reading is the worst in
the history of the series - bottom of the range. Orders and demand are
weak, in the bottom 21% of their range. Foreign orders are relatively
weak and reside in the bottom 16 percent of their range. Meanwhile
inventory levels are relatively high in the 87th percentile of their
range.
Industry in France undergoing severe downward pressure.
Today’s data on German GDP suggested that its GDP was hurt the most by
drops in exports. But then Germany is an exporting economy. Germany’s
main trade partners, like France, are in trouble so it looks like this
sort of weakness is something we will be seeing the coming months in
Germany as well.
| INSEE Manufacturing Survey | ||||||||||
|---|---|---|---|---|---|---|---|---|---|---|
| Since Jan 1990 | Since Jan 1990 | |||||||||
| OUTLOOK | Nov 08 |
Oct 08 |
Sep 08 |
Aug 08 |
%tile | Rank | Max | Min | Range | Mean |
| Industrial Prod Trend | -69 | -66 | -42 | -38 | 0.0 | 227 | 44 | -69 | 113 | -7 |
| Industrial Price Level | -17 | 14 | 27 | 41 | 16.7 | 197 | 68 | -34 | 102 | 9 |
| Production | ||||||||||
| Recent Trend | -22 | -12 | -8 | -2 | 19.7 | 214 | 35 | -36 | 71 | 5 |
| Likely trend | -28 | -22 | -11 | -6 | 0.0 | 227 | 34 | -28 | 62 | 6 |
| Orders/Demand | ||||||||||
| Orders&Demand | -45 | -32 | -25 | -22 | 21.3 | 211 | 29 | -65 | 94 | -15 |
| FgnOrders&Demand | -46 | -26 | -28 | -22 | 16.2 | 215 | 37 | -62 | 99 | -10 |
| Inventories | ||||||||||
| Levels | 26 | 22 | 18 | 17 | 87.9 | 6 | 30 | -3 | 33 | 13 |
| Prices | ||||||||||
| Likely Sales Price Trend | 0 | 8 | 14 | 16 | 50.0 | 110 | 25 | -25 | 50 | 0 |
by Louise Curley November 25. 2008

Five indicators of business and consumersentiment were
released today -- business and consumer sentiment in the Netherlands,
business sentiment in France and consumer sentiment in Italy and
Germany.
As the world financial crisis has spread and deepened, it is no surprise that global business sentiment continues to deteriorate. The deterioration in France and the Netherlands can be seen in the first chart. From a peak of 111 in April, 2007. the French synthetic index of business confidence fell to 80 in November. This is 2 standard deviations below its mean of 100 and is the lowest value since May 1993 when the index reached 74. Business sentiment in the Netherlands, which is measured in percent balances, took a similar fall. From an excess of optimists of 9.5% in January 2008, there is in November an excess of pessimists of 9.1%. This is the highest excess of pessimists since June of 2003.
Consumer sentiment in Germany, Italy and the Netherlands has shown a similar deterioration over the past year or so as shown in the second chart. There has, however, been an improvement in German consumer sentiment in the past two months and is forecast to rise further in December. It is, however still at a low level -- the excess of optimists over pessimists being 1.7 in October, 1.9% in November and 2.0% in December.
| CONFIDENCE MEASURES | Nov 08 | Oct 08 | Nov 07 | M/M chg | Y/Y chg | 2007 | 2006 | 2005 |
|---|---|---|---|---|---|---|---|---|
| France (Synthetic Index Mean=100, Std Dev=100) | - | - | - | - | - | - | - | - |
| Business Confidence | 80 | 87 | 110 | -7-8* | -27.3* | 109 | 107 | 100 |
| The Netherlands (% Balance) | - | - | - | - | - | - | - | - |
| Consumer Confidence | -29 | -27 | -3 | -2 | -26 | 8 | -1 | -22 |
| Business Confidence | -9.1 | -6.1 | 8.7 | -3.0 | -17.7 | 7.8 | 6.8 | 0.6 |
| Italy (1980=100) | - | - | - | - | - | - | - | - |
| Consumer Confidence | 100.4 | 102.2 | 107.5 | -1.7* | -6.6* | 108.5 | 108.8 | 104.2 |
| Germany (% Balance | - | - | - | - | - | - | - | - |
| GfK Consumer Confidence | 1.9 | 1.7 | 4.2 | 2.0 | -2.3 | 6.2 | 7.0 | 3.9 |
| * Percent change | - | |||||||

Tom Moeller
AuthorMore in Author Profile »Prior to joining Haver Analytics in 2000, Mr. Moeller worked as the Economist at Chancellor Capital Management from 1985 to 1999. There, he developed comprehensive economic forecasts and interpreted economic data for equity and fixed income portfolio managers. Also at Chancellor, Mr. Moeller worked as an equity analyst and was responsible for researching and rating companies in the economically sensitive automobile and housing industries for investment in Chancellor’s equity portfolio. Prior to joining Chancellor, Mr. Moeller was an Economist at Citibank from 1979 to 1984. He also analyzed pricing behavior in the metals industry for the Council on Wage and Price Stability in Washington, D.C. In 1999, Mr. Moeller received the award for most accurate forecast from the Forecasters' Club of New York. From 1990 to 1992 he was President of the New York Association for Business Economists. Mr. Moeller earned an M.B.A. in Finance from Fordham University, where he graduated in 1987. He holds a Bachelor of Arts in Economics from George Washington University.
More Economy in Brief


