 Global| Dec 16 2009
CPI's 0.4% Gain Is Fueled ByEnergy; Core Prices Are Unchanged
by:Tom Moeller
|in:Economy in Brief
Summary
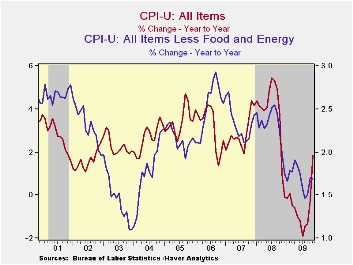
Pricing power took on a new dimension last month. Despite higher fuel costs, core prices were unchanged, a result not seen since the depths of the recent recession. The overall November CPI matched Consensus expectations and rose 0.4% [...]
 Pricing
power took on a new dimension last month. Despite higher fuel costs,
core prices were unchanged, a result not seen since the depths of the
recent recession. The overall November CPI matched Consensus
expectations and rose 0.4% after an unrevised 0.3% October increase.
Other than energy & food prices, however, consumer prices were
flat. The last time they were unchanged was December of last year when
recessionary forces were gathering steam.
Pricing
power took on a new dimension last month. Despite higher fuel costs,
core prices were unchanged, a result not seen since the depths of the
recent recession. The overall November CPI matched Consensus
expectations and rose 0.4% after an unrevised 0.3% October increase.
Other than energy & food prices, however, consumer prices were
flat. The last time they were unchanged was December of last year when
recessionary forces were gathering steam.
Energy prices jumped 4.1% m/m and have risen 18.7% so far this year. Gasoline prices were quite strong posting a 6.4% (23.6% y/y) increase and rising by more-than-half since December. Fuel oil prices also were firm and rose 7.3% (-7.7% y/y) following a 6.0% gain during October. Finally, prices for natural gas & electricity rose 1.4% (-5.0% y/y) but are down 5.1% this year.
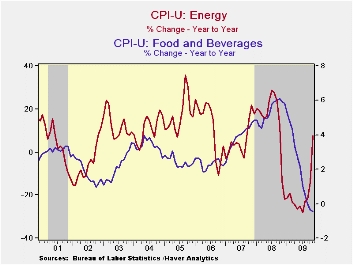 Food
& beverage prices posted another
modest 0.1% uptick. So far this year, food prices have fallen an
unprecedented 0.5%. Recent weakness has been led by lower dairy prices
(-9.0% y/y) and lower fruit & vegetable (-4.9% y/y) costs.
Prices for meats, poultry, fish & eggs also fell 4.0% y/y while
cereals & bakery product prices slipped 0.8%.
Food
& beverage prices posted another
modest 0.1% uptick. So far this year, food prices have fallen an
unprecedented 0.5%. Recent weakness has been led by lower dairy prices
(-9.0% y/y) and lower fruit & vegetable (-4.9% y/y) costs.
Prices for meats, poultry, fish & eggs also fell 4.0% y/y while
cereals & bakery product prices slipped 0.8%.
Consumer prices less food & energy were unchanged following two months of 0.2% increase. A 0.1% November uptick had been expected. The 1.7% y/y gain has been the annual growth rate of core prices all this year. Core services prices continue to feel the recession's effect and slipped slightly last month. Their 1.3% y/y gain was a record low. Weakness in the housing market accounts for much of that moderation. Last month, shelter prices slipped 0.2% and they've risen a minimal 0.2% so far in 2009. Owners equivalent rent of primary residences, a measure not equivalent to other house price measures, slipped for the fourth month in the last five and have risen 0.7% so far this year after a 2.5% increase during 2008. Elsewhere in services, public transportation prices were strong again and posted a 2.6% increase. Recent gains are, however, just making up for declines during the recession. Medical care services prices increased 0.4% (3.5% y/y). Finally, education costs have been firm, up 4.8% y/y after a 5.8% gain during 2008. The annual gain is, however, down from the 6.9% increase during 2004. Recreation prices have really shown the recession's effect and are down 0.2% y/y after a 1.6% 2008 gain.
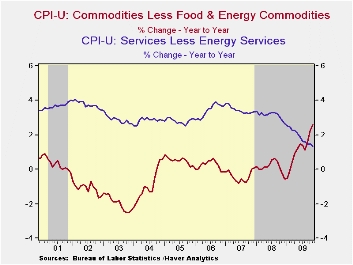 Despite
the weak economy, core goods prices have
been relatively firm and last month increased 0.2%. The increase lifted
prices 2.8% since December following no change during the prior two
years. Higher tobacco prices continued to account for much of the
recent strength and rose 1.0% last month (30.3% y/y). New &
used motor vehicles also have firmed considerably. The 0.8% increase
last month lifted prices by 5.2% since December. That compares with
price deflation during the last two years. Working the other way,
apparel prices fell for the third month in the last four (1.0% y/y.
That follows price declines which extend back to 1994. Continuing weak
were prices for household furnishings & operation. They fell
another 0.3%, leaving them down 1.1% so far this year. · The chained
CPI, which adjusts for shifts in consumption patterns, was unchanged
during November and year-to-year prices rose 1.6%. Conversely, chained
prices less food and energy edged 0.2% lower last month.
Despite
the weak economy, core goods prices have
been relatively firm and last month increased 0.2%. The increase lifted
prices 2.8% since December following no change during the prior two
years. Higher tobacco prices continued to account for much of the
recent strength and rose 1.0% last month (30.3% y/y). New &
used motor vehicles also have firmed considerably. The 0.8% increase
last month lifted prices by 5.2% since December. That compares with
price deflation during the last two years. Working the other way,
apparel prices fell for the third month in the last four (1.0% y/y.
That follows price declines which extend back to 1994. Continuing weak
were prices for household furnishings & operation. They fell
another 0.3%, leaving them down 1.1% so far this year. · The chained
CPI, which adjusts for shifts in consumption patterns, was unchanged
during November and year-to-year prices rose 1.6%. Conversely, chained
prices less food and energy edged 0.2% lower last month.
The consumer price data is available in Haver's USECON database while detailed figures can be found in the CPIDATA database.
| Consumer Price Index (%) | November | October | September | Nov. y/y | 2008 | 2007 | 2006 |
|---|---|---|---|---|---|---|---|
| Total | 0.4 | 0.3 | 0.2 | 1.8 | 3.8 | 2.9 | 3.2 |
| Total less Food & Energy | 0.0 | 0.2 | 0.2 | 1.7 | 2.3 | 2.3 | 2.5 |
| Goods less Food & Energy | 0.2 | 0.4 | 0.3 | 2.6 | 0.1 | -0.4 | 0.2 |
| Services less Energy | -0.0 | 0.1 | 0.1 | 1.3 | 3.1 | 3.4 | 3.4 |
| Energy | 4.1 | 1.5 | 0.6 | 7.7 | 13.5 | 5.7 | 11.0 |
| Food & Beverages | 0.1 | 0.1 | -0.1 | -0.5 | 5.4 | 3.9 | 2.3 |
| Chained CPI: Total (NSA) | 0.0 | 0.1 | 0.1 | 1.6 | 3.3 | 2.5 | 2.9 |
| Total less Food & Energy | -0.2 | 0.3 | 0.2 | 1.3 | 1.9 | 1.9 | 2.2 |
U.S. Housing Starts Improve Modestly
by Tom Moeller December 16, 2009
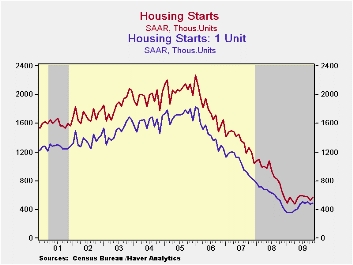 The recent
recovery in home building has been hardly ebullient. Housing starts
rose 8.9% last month to 574,000 (AR) units versus 527,000 during
October, which was revised down slightly. These levels were, however,
6.2% below the 3Q average and remain down 12.4% y/y. More sobering is
the startling decline in housing in recent years. Since the peak in
January of 2006, starts have fallen by more than three-quarters.
November's figure fell short of Consensus expectations for 578,000
starts.
The recent
recovery in home building has been hardly ebullient. Housing starts
rose 8.9% last month to 574,000 (AR) units versus 527,000 during
October, which was revised down slightly. These levels were, however,
6.2% below the 3Q average and remain down 12.4% y/y. More sobering is
the startling decline in housing in recent years. Since the peak in
January of 2006, starts have fallen by more than three-quarters.
November's figure fell short of Consensus expectations for 578,000
starts.
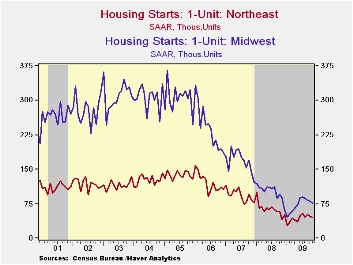 Last
month, starts of single-family homes recovered
merely 2.1% to 482,000 after October's 7.1% decline. So far this
quarter, starts have fallen 4.2% from the 3Q average. Despite this loss
of forward momentum, single-family starts have recovered
from the February low. During the last ten years, there has been an 84%
correlation between the q/q change in single-family starts and their
contribution to quarterly GDP growth. The increase in
starts of single-family units was contained to the Southern (12.9% y/y)
and the Western (2.1% y/y) regions of the country. Elsewhere, starts in
the Northeast (2.1% y/y) and in the Midwest (-13.6% y/y) fell
month-to-month.
Last
month, starts of single-family homes recovered
merely 2.1% to 482,000 after October's 7.1% decline. So far this
quarter, starts have fallen 4.2% from the 3Q average. Despite this loss
of forward momentum, single-family starts have recovered
from the February low. During the last ten years, there has been an 84%
correlation between the q/q change in single-family starts and their
contribution to quarterly GDP growth. The increase in
starts of single-family units was contained to the Southern (12.9% y/y)
and the Western (2.1% y/y) regions of the country. Elsewhere, starts in
the Northeast (2.1% y/y) and in the Midwest (-13.6% y/y) fell
month-to-month.
A bit firmer were starts of multi-family units which nearly doubled m/m during November from their record low. Starts of apartments, condominiums & town houses still were down 79.6% from the January 2006 peak.
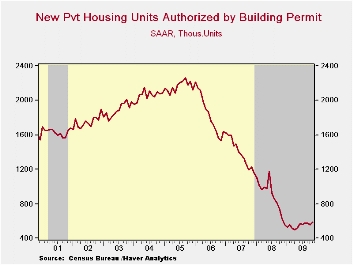 Perhaps
more strength in starts is coming.
Building permits rose 6.0% during November to their highest level in
twelve months. As with starts, permits to build a single-family home
have been relatively strong versus the total. Moreover, they rose 5.3%
versus 3Q they have risen 38.3% from the January low.
Perhaps
more strength in starts is coming.
Building permits rose 6.0% during November to their highest level in
twelve months. As with starts, permits to build a single-family home
have been relatively strong versus the total. Moreover, they rose 5.3%
versus 3Q they have risen 38.3% from the January low.
The housing starts figures can be found in Haver's USECON database.
Housing's Great Fall: Putting Household Balance Sheets Together Again from the Federal Reserve Bank of St. Louis is available here.
| Housing Starts (000s, SAAR) | November | October | September | Nov. Y/Y | 2008 | 2007 | 2006 |
|---|---|---|---|---|---|---|---|
| Total | 574 | 527 | 586 | -12.4% | 900 | 1,342 | 1,812 |
| Single-Family | 482 | 472 | 508 | 5.5 | 616 | 1,036 | 1,474 |
| Multi-Family | 92 | 55 | 78 | -53.5 | 285 | 306 | 338 |
| Building Permits | 584 | 551 | 575 | -7.3 | 895 | 1,392 | 1,844 |
Japan's Service Sector Shows Improvement
by Robert Brusca December 16, 2009
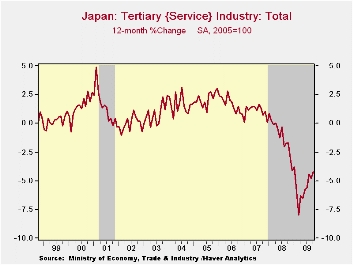
Japan’s service sector as gauged by its tertiary sector index advanced in October after registering a drop in September. The index is down by 4.3 percent over 12-months compared to MFG and mining where the index is down by 14% over 12-months. These drops compare to March and February lows in the two indices, respectively. In March the tertiary index was down by 8.6% Yr/Yr. In February the mining and MFG index scored its largest 12-month drop at -36.9%.
Cleary Japan has been improving sharply from its recession lows. But while the mining and MFG sector has eight straight months of improvement in its mo/mo readings, services has only improved for one month in a row. Services also has improved in five of the past six months. Still, the tertiary sector is only up by 2.5% from its cycle low point whereas MFG and mining is up by 23.8% from its cycle low reading. MFG and mining currently stands by 21.8% below its cycle peak whereas the services sector is off by just 6.4% from its cycle peak. Two sectors are experiencing very different recession and recovery forces.
The service sector stands in the 53rd percentile of its range while Mining and MFG stands in the 40th percentile of its range, well below its mid-way mark.
Still, the failure of services to post consistent gains or strong gains while MFG is improving sharply is a sign that Japan is still struggling. We know it is having some renewed problems with deflation. In this environment because the service sector employs so many, it is easy to see why confidence does not easily come back and why Japan remains vulnerable to deflation even in face of some export recovery and a strong MFG rebound. The rising yen has pre-empted the possibility of compensation for service sector weakness with strong export-led growth. While Japan’s exports are recovering they are also hindered by the continuing strength of the yen. Japan’s recovery continues to face a dilemma
Japan Industry Survey| Recent Months | Moving Averages | Extremes; Range | |||||||
| Oct-2009 | Sep-2009 | Aug-2009 | 3-Mo | 6-Mo | 12-Mo | Max | Min | %-Tile | |
| Mining and MFG | 86.1 | 85.7 | 83.9 | 85.2 | 83.1 | 80.7 | 110.1 | 69.5 | 40.9% |
| Tertiary | 96.8 | 96.3 | 96.9 | 96.7 | 96.4 | 97.0 | 103.5 | 89.1 | 53.5% |
| Ranges, Max, Min since 1993 | |||||||||
FOMC Notes Economic & Job Market Improvement But Leaves Rates Unchanged
by Tom Moeller December 16, 2009
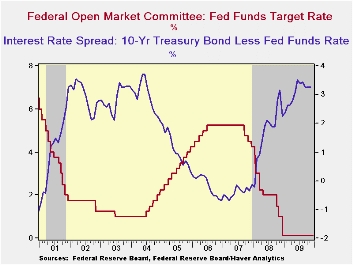 In an
anticipated and unanimous vote, the Federal Open Market Committee today
left the Federal funds rate in a "range from 0 to 1/4 percent." The
discount rate also was left unchanged at 0.5%. The action was as
expected and left the Fed funds rate at its lowest level ever.
In an
anticipated and unanimous vote, the Federal Open Market Committee today
left the Federal funds rate in a "range from 0 to 1/4 percent." The
discount rate also was left unchanged at 0.5%. The action was as
expected and left the Fed funds rate at its lowest level ever.
"Information received since the Federal Open Market Committee met in November suggests that economic activity has continued to pick up and that the deterioration in the labor market is abating." Thus reads the opening statement from today's FOMC meeting press release. The statement then cites improvement in each of the economy's sectors; however, it notes that activity "is likely to remain weak for a time ..."
 The
statement goes on to suggest that economic strengthening will
result from monetary & fiscal stimulus.
The
statement goes on to suggest that economic strengthening will
result from monetary & fiscal stimulus.
The Fed mentioned price inflation twice, indicating that "higher levels of resource utilization would occur in the context of price stability" and that "inflation will remain subdued for some time" as resource utilization remained low.
Again the Fed indicated that moderate economic growth and slack capacity utilization would allow rates to say low for an extended period of time. Also, "To provide support to mortgage lending and housing markets and to improve overall conditions in private credit markets, the Federal Reserve is in the process of purchasing $1.25 trillion of agency mortgage-backed securities and about $175 billion of agency debt. In order to promote a smooth transition in markets, the Committee is gradually slowing the pace of these purchases, and it anticipates that these transactions will be executed by the end of the first quarter of 2010."
 A complete
text of the Fed's latest press
release can be found here.
A complete
text of the Fed's latest press
release can be found here.
The Haver databases USECON, WEEKLY and DAILY contain the figures from the Federal Reserve Board.
Supply and Demand Shocks in Residential Mortgages from the Federal Reserve Bank of Cleveland can be found here.
| Current | Last | December | 2008 | 2007 | 2006 | |
|---|---|---|---|---|---|---|
| Federal Funds Rate, % (Target) | 0.00 - 0.25 | 0.00 - 0.25 | 0.16 | 1.93 | 5.02 | 4.96 |
| Discount Rate, % | 0.50 | 0.50 | 0.50 | 2.39 | 5.86 | 5.96 |

Tom Moeller
AuthorMore in Author Profile »Prior to joining Haver Analytics in 2000, Mr. Moeller worked as the Economist at Chancellor Capital Management from 1985 to 1999. There, he developed comprehensive economic forecasts and interpreted economic data for equity and fixed income portfolio managers. Also at Chancellor, Mr. Moeller worked as an equity analyst and was responsible for researching and rating companies in the economically sensitive automobile and housing industries for investment in Chancellor’s equity portfolio. Prior to joining Chancellor, Mr. Moeller was an Economist at Citibank from 1979 to 1984. He also analyzed pricing behavior in the metals industry for the Council on Wage and Price Stability in Washington, D.C. In 1999, Mr. Moeller received the award for most accurate forecast from the Forecasters' Club of New York. From 1990 to 1992 he was President of the New York Association for Business Economists. Mr. Moeller earned an M.B.A. in Finance from Fordham University, where he graduated in 1987. He holds a Bachelor of Arts in Economics from George Washington University.
More Economy in Brief


