 Global| Sep 18 2002
CPI Rose More Than Expected
by:Tom Moeller
|in:Economy in Brief
Summary
Consumer prices (CPI-U) rose 0.3% last month. Consensus expectations were for a 0.2% gain. Excluding food and energy, prices also rose a more than expected 0.3%. Pricing strength centered on higher tobacco prices, up 2.4%. [...]
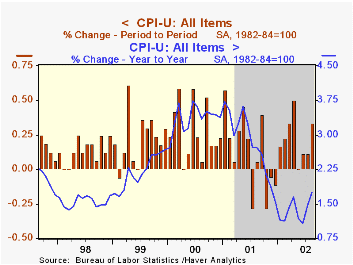
Consumer prices (CPI-U) rose 0.3% last month. Consensus expectations were for a 0.2% gain. Excluding food and energy, prices also rose a more than expected 0.3%.
Pricing strength centered on higher tobacco prices, up 2.4%. Nevertheless, the core CPI less tobacco rose 0.3%. Apparel prices rose 1.1% following four consecutive months of decline. Shelter prices rose 0.4%, the strongest gain since April. Public transportation prices rose 0.8%, the first rise in three months. Education prices rose a strong 0.7% for the second consecutive month.
Home furnishings prices fell 0.3%, the seventh month of negative or zero change this year. New vehicle prices also were down 0.1% and have fallen or been unchanged in each month of this year. Medical care prices rose only 0.2% following a 0.7% July gain.
The August chained CPI as well as the core chained CPI rose the same as the official figures.
| Consumer Price Index | Aug | July | Y/Y | 2001 | 2000 | 1999 |
|---|---|---|---|---|---|---|
| Total | 0.3% | 0.1% | 1.7% | 2.8% | 3.4% | 2.2% |
| Total less Food & Energy | 0.3% | 0.2% | 2.4% | 2.7% | 2.4% | 2.1% |
| Goods less Food & Energy | 0.2% | -0.1% | -0.8% | 0.3% | 0.5% | 0.7% |
| Services less Energy | 0.4% | 0.3% | 3.7% | 3.7% | 3.3% | 2.7% |
| Energy | 0.6% | 0.4% | -3.0% | 3.7% | 16.9% | 3.6% |
| Food & Beverages | -0.1% | 0.2% | 1.3% | 3.1% | 2.3% | 2.1% |
| Chained CPI: Total (NSA)l | 0.3% | 0.0% | 1.3% | 2.1% | 2.0% | NA |
| Total less Food & Energy | 0.3% | 0.0% | 1.7% | 1.9% | 1.4% | NA |
by Tom Moeller September 18, 2002
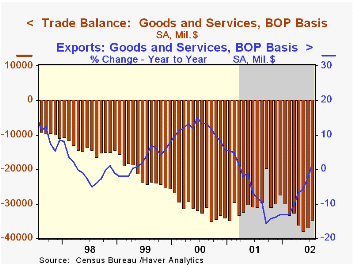
The U.S. foreign trade deficit improved notably in July. The improvement follows improvement in June. June's deficit was lessened from $37.8B reported last month. Consensus expectations were for a July deficit of $37.0B
Exports rose strongly for the fourth month in five. Capital goods exports rose for the third consecutive month (13.3% AR, YTD) and nonauto consumer goods (3.0% AR, YTD) were quite strong for the third month in four.
Imports fell due to declines in capital goods (11.4% AR, YTD) and nonauto consumer goods (27.1% AR, YTD). Imports of industrial supplies and materials rose modestly but are up 44.9% (AR) this year on higher oil prices.
The refiner's acquisition cost of imported crude oil rose to $24.41 in July versus $15.95 in December. Crude oil prices rose further August and September.
| Foreign Trade | July | June | Y/Y | 2001 | 2000 | 1999 |
|---|---|---|---|---|---|---|
| Trade Deficit | $34.6B | $36.8B | $30.8B(7/01) | $358.3B | $378.7B | $262.2B |
| Exports - Goods & Services | 1.3% | 1.4% | 1.3% | -6.2% | 11.2% | 2.6% |
| Imports - Goods & Services | -1.0% | 0.2% | 4.2% | -6.0% | 18.3% | 10.9% |

Tom Moeller
AuthorMore in Author Profile »Prior to joining Haver Analytics in 2000, Mr. Moeller worked as the Economist at Chancellor Capital Management from 1985 to 1999. There, he developed comprehensive economic forecasts and interpreted economic data for equity and fixed income portfolio managers. Also at Chancellor, Mr. Moeller worked as an equity analyst and was responsible for researching and rating companies in the economically sensitive automobile and housing industries for investment in Chancellor’s equity portfolio. Prior to joining Chancellor, Mr. Moeller was an Economist at Citibank from 1979 to 1984. He also analyzed pricing behavior in the metals industry for the Council on Wage and Price Stability in Washington, D.C. In 1999, Mr. Moeller received the award for most accurate forecast from the Forecasters' Club of New York. From 1990 to 1992 he was President of the New York Association for Business Economists. Mr. Moeller earned an M.B.A. in Finance from Fordham University, where he graduated in 1987. He holds a Bachelor of Arts in Economics from George Washington University.


