 Global| Nov 18 2009
CPI Increases Remain Moderate
by:Tom Moeller
|in:Economy in Brief
Summary
Pricing pressure continued under control last month. The overall October CPI roughly matched Consensus expectations and rose 0.3%, despite energy prices which rose m/m. Stripping out both energy & food prices, consumer prices [...]
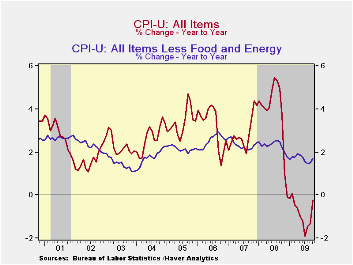 Pricing
pressure continued under control last month. The overall October CPI
roughly matched Consensus expectations and rose 0.3%, despite energy
prices which rose m/m. Stripping out both energy & food prices,
consumer prices increased 0.2% as they did during September. However,
the y/y increase in "core" prices picked up modestly to 1.7% from its
weakest since early-2004.
Pricing
pressure continued under control last month. The overall October CPI
roughly matched Consensus expectations and rose 0.3%, despite energy
prices which rose m/m. Stripping out both energy & food prices,
consumer prices increased 0.2% as they did during September. However,
the y/y increase in "core" prices picked up modestly to 1.7% from its
weakest since early-2004.
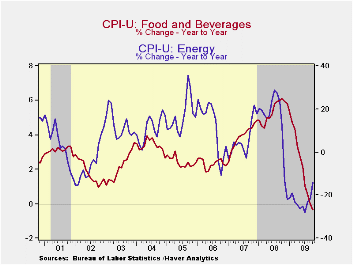 Energy prices continued their
recovery with a 1.5% m/m increase, bringing the three-month annual rate
of growth to 30.1%. Fuel oil prices surged 6.0% (-23.5% y/y) after
smaller gains during the prior two months while gasoline prices
increased another 1.6% (-17.9% y/y) following a 1.0% gain during
September. Finally, prices for natural gas & electricity rose
0.9% (-7.2% y/y) after little change during the prior two months.
Energy prices continued their
recovery with a 1.5% m/m increase, bringing the three-month annual rate
of growth to 30.1%. Fuel oil prices surged 6.0% (-23.5% y/y) after
smaller gains during the prior two months while gasoline prices
increased another 1.6% (-17.9% y/y) following a 1.0% gain during
September. Finally, prices for natural gas & electricity rose
0.9% (-7.2% y/y) after little change during the prior two months.
Food & beverage prices continued weak last month with a 0.1% uptick. So far this year, food prices have fallen an unprecedented 0.6%. Recent weakness has been led by lower dairy prices (-8.2% y/y) and lower fruit & vegetable (-5.6% y/y) costs. Prices for meats, poultry, fish & eggs also fell 4.8% y/y while cereals & bakery product prices were off 0.6%.
 Inflation in the CPI less food &
energy also remained moderate but, like the previous month, the 0.2%
October increase was slightly firmer than expected. Price gains
accelerated to a 2.0% annual rate since December of last year. That's
only slightly below the 2.3% rates of increase during the last two
years.
Inflation in the CPI less food &
energy also remained moderate but, like the previous month, the 0.2%
October increase was slightly firmer than expected. Price gains
accelerated to a 2.0% annual rate since December of last year. That's
only slightly below the 2.3% rates of increase during the last two
years.
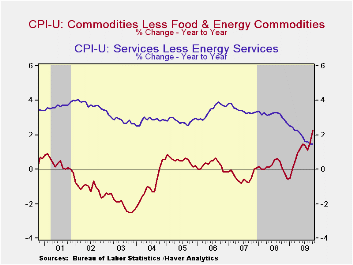
Despite the weak economy, the acceleration in core price inflation this year owes to faster increases in core goods prices. Their 0.4% increase last month lifted the annualized rate so far in 2009 to 3.2% from no change during the prior two years. Higher tobacco prices continued to account for much of that acceleration. In addition, there has been a firming of prices elsewhere. Prices for new & used motor vehicles have firmed despite an aggressive marketing campaign, up 1.7% last month and at a 5.2% rate since December. They rose 0.3% last month and at a 35.0% annual rate since December. That compares with price deflation during the last two years. Though apparel prices ticked 0.4% lower last month they've risen at an accelerated 2.3% rate this year. That follows price declines which extends back to 1994. Continuing weak were prices for household furnishings & operation. They fell another 0.5% leaving them down at a 1.0% rate so far this year.
The U.S. recession continued to hold back growth in core services prices. Again, they ticked up just 0.1% last month and have risen at a 1.5% annual rate so far this year, half that in 2008 and nearly the weakest since 1983. Weakness in the housing market accounts for much of that moderation. Last month, shelter prices were unchanged and they've risen at a just a 0.6% annual rate so far in 2009. Owners equivalent rent of primary residences, a measure not equivalent to other house price measures, again slipped m/m and have risen at a 1.0% rate so far this year versus a 2.5% 2008 increase. Elsewhere in services, public transportation prices again were strong and rose 0.9% (-4.5% y/y). Medical care services prices ticked up 0.2% but at a 3.4% rate this year. That compares to a 4.2% increase last year. Finally, education costs have been firm and they're up at a 4.9% annual rate this year after a 5.8% gain during 2008. However, recreation prices are roughly unchanged this year after a 1.6% 2008 gain.
The chained CPI, which adjusts for shifts in consumption patterns, rose 0.1% during October while year-to-year prices fell 0.5%. Conversely, chained prices less food and energy firmed last month by 0.3%, only the second material gain in five months.
The consumer price data is available in Haver's USECON database while detailed figures can be found in the CPIDATA database.
| Consumer Price Index (%) | October | Oct. Y/Y | September | August | 2008 | 2007 | 2006 |
|---|---|---|---|---|---|---|---|
| Total | 0.3 | -0.2 | 0.2 | 0.4 | 3.8 | 2.9 | 3.2 |
| Total less Food & Energy | 0.2 | 1.7 | 0.2 | 0.1 | 2.3 | 2.3 | 2.5 |
| Goods less Food & Energy | 0.4 | 2.3 | 0.3 | -0.3 | 0.1 | -0.4 | 0.2 |
| Services less Energy | 0.1 | 1.5 | 0.1 | 0.2 | 3.1 | 3.4 | 3.4 |
| Energy | 1.5 | -14.1 | 0.6 | 4.6 | 13.5 | 5.7 | 11.0 |
| Food & Beverages | 0.1 | -0.3 | -0.1 | 0.1 | 5.4 | 3.9 | 2.3 |
| Chained CPI: Total (NSA) | 0.1 | -0.5 | 0.1 | 0.2 | 3.3 | 2.5 | 2.9 |
| Total less Food & Energy | 0.3 | 1.3 | 0.2 | 0.1 | 2.0 | 2.0 | 2.2 |

Tom Moeller
AuthorMore in Author Profile »Prior to joining Haver Analytics in 2000, Mr. Moeller worked as the Economist at Chancellor Capital Management from 1985 to 1999. There, he developed comprehensive economic forecasts and interpreted economic data for equity and fixed income portfolio managers. Also at Chancellor, Mr. Moeller worked as an equity analyst and was responsible for researching and rating companies in the economically sensitive automobile and housing industries for investment in Chancellor’s equity portfolio. Prior to joining Chancellor, Mr. Moeller was an Economist at Citibank from 1979 to 1984. He also analyzed pricing behavior in the metals industry for the Council on Wage and Price Stability in Washington, D.C. In 1999, Mr. Moeller received the award for most accurate forecast from the Forecasters' Club of New York. From 1990 to 1992 he was President of the New York Association for Business Economists. Mr. Moeller earned an M.B.A. in Finance from Fordham University, where he graduated in 1987. He holds a Bachelor of Arts in Economics from George Washington University.
More Economy in Brief


