 Global| Jan 25 2005
Consumer Confidence in the Euro Area Still at Low Levels: Italy a Bit Worse, The Netherlands a Bit Better
Summary
Italy and the Netherlands released indicators of consumer confidence data today. Italian consumers became a little less confident while the Dutch consumers became a little more confident. Neither group is particularlyoptimistic as can [...]
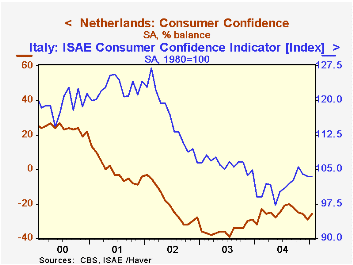
Italy and the Netherlands released indicators of consumer confidence data today. Italian consumers became a little less confident while the Dutch consumers became a little more confident. Neither group is particularlyoptimistic as can be see in the attached chart.
The seasonally adjusted index (1980=100) of Italian consumer confidence declined to 103,3 in January from 103.5 in December. It was the third month of decline from the October high for the year of 105.5. The income tax reduction enacted this month is not likely to be a strong stimulus to consumer demand. It amounts to 6 billion euros, or about one tenth of total household consumption expenditures. In the latest survey the percentage of Italian consumers who are very likely to buy and those who probably will buy a car was 6% compared with 23-25% in the late eighties and nineties as seen in the second chart. 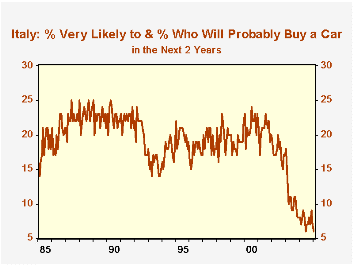
The Netherlands Confidence Indicator reflects the balance of optimists over pessimists. In January the pessimists outweighed the optimists by 26%, but this was somewhat better than the 29% balance of pessimists in December. Dutch consumers appear to be less pessimistic about their willingness to buy. The January figure of -20 is a 4 point improvement over December and a 2 point improvement over January of 2004.
| Italy: Consumer Confidence (1980=100) | Jan 05 | Dec 04 | Jan 04 | M/M % | Y/Y % | 2004 | 2003 | 2002 |
|---|---|---|---|---|---|---|---|---|
| Consumer Confidence Indicator | 103.3 | 103.5 | 99.0 | -0.10 | 4.34 | 101.4 | 106.2 | 115.8 |
| Purchase of Car over nest 2 Years | Jan 05 | Dec 04 | Jan 04 | M/M Dif | Y/Y Dif | 2004 | 2003 | 2002 |
| % Very Likely | 2 | 2 | 3 | 0 | -1 | 2 | 3 | 5 |
| % Probably Will | 4 | 5 | 5 | -1 | -1 | 6 | 8 | 12 |
| Netherlands Consumer Confidence % Balance | Jan 05 | Dec 04 | Jan 04 | M/M Dif | Y/Y Dif | 2004 | 2003 | 2002 |
| Overall confidence | -26 | -29 | -32 | 3 | 6 | -25 | -35 | -20 |
| Willingness to Buy | -20 | -24 | -22 | 4 | 2 | -21 | -21 | -8 |
More Economy in Brief


