 Global| Nov 27 2007
Consumer Confidence Crumbled With Lower Home Prices
by:Tom Moeller
|in:Economy in Brief
Summary
According to the Conference Board Survey consumer confidence dropped 8.3% in November to a reading of 87.3, the seventh m/m decline of 2007 and the largest since September 2005. The decline was to the lowest level in two years. A much [...]
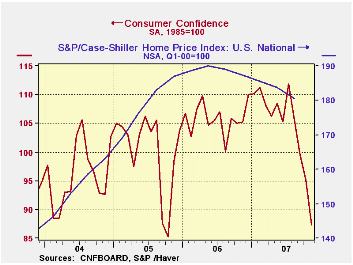
According to the Conference Board Survey consumer confidence dropped 8.3% in November to a reading of 87.3, the seventh m/m decline of 2007 and the largest since September 2005. The decline was to the lowest level in two years. A much lesser drop to 91.4 had been generally expected by economists.
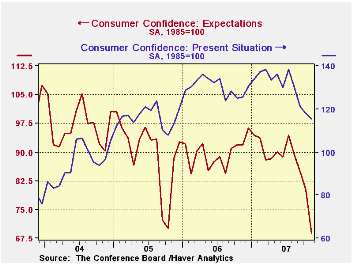
The expectations index fell out of bed and posted a 14.1% m/m drop. It is off by a quarter during the last twelve months. Expectations for employment (more jobs) fell to a meager 10.8% looking for a rise, the least since the recession of 1990.Only 12.4% of respondents expected better business conditions, the least since 2000 while 18.7% expected an improvement in their income. That was down just slightly.
Plans to buy major appliances in the next six months improved slightly from a very depressed October level but the percentage intending to buy a home collapsed to just 2.5%, the least since 1994.
Just 2.0% of respondents planned to by a new automobile within the next six months, the least since 1974.
The present conditions index fell 2.2%, similar to the October m/m decline. The decline was to a level which was the lowest in about two years. Just 22.3% saw business conditions as good, the least since 2004, and 23.2% saw jobs as plentiful. A lesser 21.3% of respondents viewed jobs as hard to get.
The expected inflation rate in twelve months jumped to 5.7%
from 5.1% in October, the highest expectation in two years.
According to the S&P/Case-Shiller home price index Composite 20, U.S. home prices fell 0.9% m/m in September. The decline pulled the y/y comparison to a negative 4.9% and since the beginning of this year house prices have fallen 3.8%.
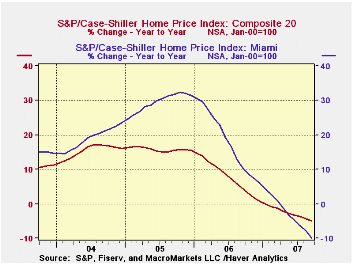
Home prices in San Diego California were extremely weak with a 9.6% y/y decline as were prices in Miami Florida which fell 10.0% y/y. In Las Vegas home prices fell 9.0% y/y and in Los Angeles prices fell 7.0%.
More moderate, but still substantial, declines were registered in New York (-3.6% y/y), Chicago (-2.5% y/y) and Denver (-0.9%).
The index of just 20 U.S. cities and their surrounding areas is not adjusted for the quality or the size of the home. It fell five percent in August from a year ago.
| Conference
Board (SA, 1985=100) |
November | October | Y/Y | 2006 | 2005 | 2004 |
|---|---|---|---|---|---|---|
| Consumer Confidence Index | 87.3 | 95.2 | -17.1% | 105.9 | 100.3 | 96.1 |
| Present Conditions | 115.4 | 118.0 | -8.0% | 130.2 | 116.1 | 94.9 |
| Expectations | 68.7 | 80.0 | -25.2% | 89.7 | 89.7 | 96.9 |
by Tom Moeller November 27, 2007
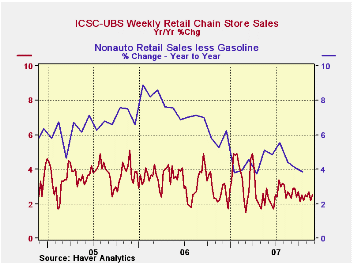
Chain store sales dipped 0.1% last week after posing a 0.8% rise during the prior week, according to the International Council of Shopping Centers (ICSC)-UBS.
Despite the weak performance during Thanksgiving week, sales for the month of November rose 0.4% from the October average which fell 0.8% from September.
During the last ten years there has been a 45% correlation
between the y/y change in chain store sales and the change in nonauto
retail sales less gasoline.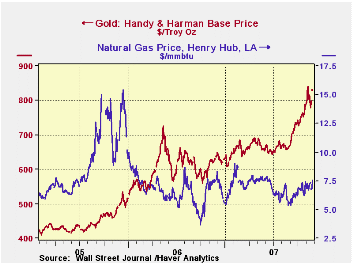
The ICSC-UBS retail chain-store sales index is constructed using the same-store sales (stores open for one year) reported by 78 stores of seven retailers: Dayton Hudson, Federated, Kmart, May, J.C. Penney, Sears and Wal-Mart.
The leading indicator of chain store sales from ICSC-UBS fell 0.1% (-1.1% y/y) for the second weekly decline.
| ICSC-UBS (SA, 1977=100) | 11/24/07 | 11/17/07 | Y/Y | 2006 | 2005 | 2004 |
|---|---|---|---|---|---|---|
| Total Weekly Chain Store Sales | 478.2 | 478.8 | 2.5% | 3.3% | 3.6% | 4.7% |
by Tom Moeller November 27, 2007
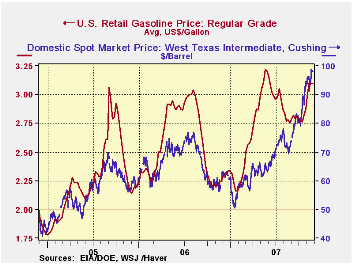
On average, retail gasoline prices last week held at the prior period's level of $3.10 per gallon, according to the US Department of Energy survey.
Divided by consumer prices other than energy, these gasoline prices are just below the high reached in 1981.
Yesterday, prices for spot WTI crude oil stood at $97.71 per barrel, down slightly from last week's average.
In perhaps a favorable sign for home heating bills this season, natural gas prices continued the move sideways at the high end of the recent $6.5 - $7.5 per mmbtu range (-0.3% y/y).
Gold prices continued to hover around the $800 per ounce level and the level surpassed the previous record price reached in early 1980.
Oil Shocks and Price Stability from the Federal Reserve Bank of St. Louis is available here.
| Weekly Prices | 11/26/07 | 11/19/07 | Y/Y | 2006 | 2005 | 2004 |
|---|---|---|---|---|---|---|
| Retail Gasoline ($ per Gallon) | 3.10 | 3.10 | 37.9% | 2.57 | 2.27 | 1.85 |
| Light Sweet Crude Oil, WTI ($ per bbl.) | 98.83 | 91.18 | 70.3% | 61.11 | 58.16 | 41.78 |
| Gold: Handy & Harmon ($ per Troy Oz.) | $795.50 | $804.25 | 27.4% | 628.70 | $507.40 | $443.40 |
by Robert Brusca November 27, 2007
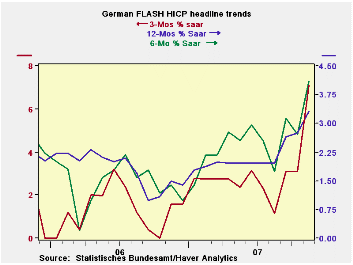
There is not much to say about Germany’s flash HICP since the
report provides no detail. But the headline says quite a lot this
month. Inflation in Germany is steadily accelerating. In prior months
core inflation had crept up above the 2% mark which is the ECB’s top
allowed rate for all of inflation for the whole of the Euro area. At
3.3% Germany’s headline rate is way over the ECB’s top allotment and
Germany has been a low inflation country. ECB members have been warning
of inflation pressures for some time. Money and credit growth in the
monetary union remain above their respective comfort marks. But the
financial turbulence has not gone away. With this report the ECB is
again on the hot seat.
| German HICP and CPI details | |||||||
|---|---|---|---|---|---|---|---|
| Mo/Mo % | Saar % | Yr/Yr | |||||
| Nov-07 | Oct-07 | Sep-07 | 3-Mo | 6-Mo | 12-Mo | Yr Ago | |
| HICP Total | 0.9% | 0.2% | 0.7% | 7.1% | 4.1% | 3.3% | 1.5% |
by Robert Brusca November 27, 2007
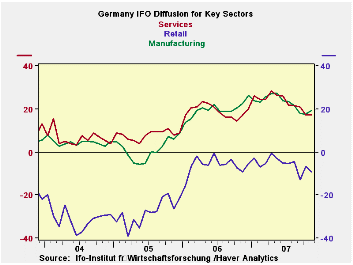
The overall IFO business sentiment index rose to 104.2 in
November from 103.9 in October. Current conditions improved to 110.4
from 109.6. But expectations slipped to 98.3 from 98.6. Even so the
table below shows that the growth of the various indexes is slipping
further. The Biz climate index, though higher on the month, is 2.5%
lower year/year worse off than in October. The current conditions index
has fallen more year/year as well. Business Expectations are off by 2%,
their worst year/year drop so far.
The graph speaks to sectors. Retailing is weakening. Services
are flattening. Manufacturing actually picked up in the month, but not
by a lot.
| IFO Survey: Germany | |||||||||
|---|---|---|---|---|---|---|---|---|---|
| Percent: Yr/Yr | Index Numbers | ||||||||
| Nov 07 |
Oct 07 |
Sep 07 |
Aug 07 |
Jul 07 |
Current | Average | Curr/Avg | %tile | |
| Biz Climate | -2.5% | -1.5% | -0.9% | 0.7% | 0.8% | 104.2 | 95.8 | 108.8% | 81.0% |
| Current Situation | -3.1% | -2.1% | -1.3% | 2.5% | 2.4% | 110.4 | 94.9 | 116.3% | 84.8% |
| Biz Expectations: Next 6-Mos | -2.0% | -0.7% | -0.4% | -1.1% | -0.9% | 98.3 | 96.7 | 101.6% | 67.3% |

Tom Moeller
AuthorMore in Author Profile »Prior to joining Haver Analytics in 2000, Mr. Moeller worked as the Economist at Chancellor Capital Management from 1985 to 1999. There, he developed comprehensive economic forecasts and interpreted economic data for equity and fixed income portfolio managers. Also at Chancellor, Mr. Moeller worked as an equity analyst and was responsible for researching and rating companies in the economically sensitive automobile and housing industries for investment in Chancellor’s equity portfolio. Prior to joining Chancellor, Mr. Moeller was an Economist at Citibank from 1979 to 1984. He also analyzed pricing behavior in the metals industry for the Council on Wage and Price Stability in Washington, D.C. In 1999, Mr. Moeller received the award for most accurate forecast from the Forecasters' Club of New York. From 1990 to 1992 he was President of the New York Association for Business Economists. Mr. Moeller earned an M.B.A. in Finance from Fordham University, where he graduated in 1987. He holds a Bachelor of Arts in Economics from George Washington University.
More Economy in Brief


