 Global| Jan 23 2009
Consensus Forecast for 4Q GDP:Activity Down 5%
by:Tom Moeller
|in:Economy in Brief
Summary
The 4Q 08 figures for Gross National Product will be available next Friday at 8:30 A.M. As always, the data will be a key gauge for measuring the current shape of the economy. And the news is not likely to be pleasant reading. It's [...]
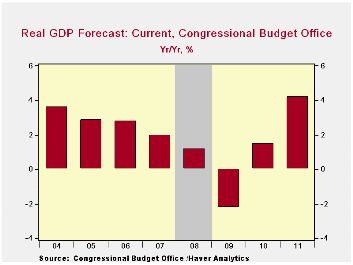
The 4Q 08 figures for Gross National Product will be available next Friday at 8:30 A.M. As always, the data will be a key gauge for measuring the current shape of the economy. And the news is not likely to be pleasant reading. It's easy to now generate an estimate that economic activity fell at a 5.1% annual rate last quarter, which indeed is the current Consensus forecast. The range of forecasts extends, however, from -2.0% to -7.5%.
By itself, the magnitude of the drop expected by Consensus
would be the fastest since the middle of the 1981-82 recession.
Peak-to-trough activity declined during that recession by 2.9%
reflecting a pattern of sharp decline early, then nine months of
stagnation. This time no such pattern is foreseen by Consensus
estimates. Another sharp drop in GDP is expected for this quarter,
1Q09, then a slight decline in 2Q. A downturn following that pattern
would make it severe and the harshest since the end of WWII.The
Recession in Perspective from the Federal Reserve Bank of
Minneapolis can be found
here.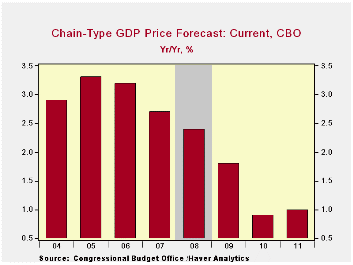
The table below contains a set of estimates for the 4Q GDP components, generated mostly from the monthly data that already is available. As might be expected, consumer spending and housing lead the downturn. Developing estimates for the worst case outcome of a 7.5% decline in activity is relatively easy by just changing the expectation for consumer spending to -8.0%, perhaps due to weaker vehicle sales, and eliminating the addition from an improved trade deficit.
General expectations are for a subpar, 2H recovery with quarterly gains of 1.0% to 2.0%. Persistent declines in consumer spending coupled with further weakness in housing would easily unravel those expectations. Moreover, lagged declines in business investment and weaker exports due to recessions abroad could add to any lack of forward economic momentum. However, there is the potential for some upside. Pent-up demand for consumer durables could be unleashed with the huge amount of monetary stimulus already in place and an easing of tight credit conditions.
In this era of recession and weak growth, price inflation seems not to be an issue. Growth in the GDP chain prices is expected to drop to 1.0% by 2010 where it is expected to remain in 2011.
| U.S. GDP Components (%, AR) | 4Q (Estimate) | GDP Weight | 3Q | 2007 | 2006 | 2005 |
|---|---|---|---|---|---|---|
| GDP | -5.1 | -0.5 | 2.0 | 2.8 | 2.9 | |
| Personal Consumption Expenditures | -6.0 | .70 | -3.8 | 2.8 | 3.0 | 3.0 |
| Residential Investment | -20.0 | .03 | -16.1 | -17.9 | -7.1 | 6.3 |
| Business Investment | -15.0 | .12 | -1.7 | 4.9 | 7.5 | 7.2 |
| Government Spending | 3.0 | .17 | 5.8 | 2.1 | 1.7 | 0.4 |
| Inventories (Contribution to GDP Growth) | 0.0 | -- | 0.8 | -0.4 | -0.0 | -0.1 |
| Net Exports (Contribution to GDP Growth) | 1.0 | -- | 1.1 | 0.6 | -0.0 | -0.2 |
PMI Indices for EMU Bounce – Dead Cat or Live One?
by Robert Brusca January 23, 2009
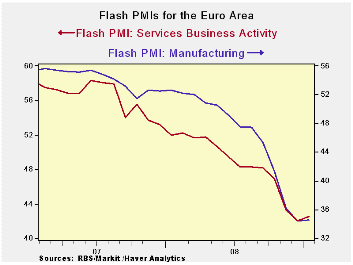
Hooray! The MFG and Services PMIs for Europe in January have
bounced. It’s too soon to call it a bottom but since they are bouncing
off historic- or near-historic lows, maybe we have seen the worst of
decay. Even if that is true it is a far cry from saying we are about to
embark on recovery.
What it means - At a reading of 34 for MFG, the sector is
telling us that about 34% of the industries are expanding… (That is
strictly speaking an improper interpretation since the PMI reading is
all the ‘up’ readings plus ‘half the unchanged responses’ and there are
myriad ways to get that result. A given PMI reading does not tell you
how many, or which proportion, of industries are expanding. But the
reading of 34 is ‘as if’ 34% were rising and the rest falling although
fewer may be rising and twice the residual might be unchanged. I will
use this short hand of treating the PMI as if it were an ‘up only’
index for simplicity but the reader should understand that the truth is
a bit more complex- I think nothing is lost by this expositional
device.). For services the reading of +42 is coming off that (shorter)
series’ all-time low.
Lots of weakness ahead - In any event it is clear that these
two measures can rise for some time and still not get back to neutral
(a reading of 50 is neutral- half the sectors expanding, half
contracting).
‘Neutral’ is not ‘normal’ - And of course ‘neutral’ is not the
same as ‘normal’. When you put your car in ‘neutral’ is neither in
‘drive’ nor ‘reverse’. If we were to average what gear your car were in
most of the time the average would not be close to neutral. Similarly,
since July 1998 when the services measure was launched it has averaged
54.2. Over the same span the MFG index has averaged 52. On balance more
sectors are expanding than contracting in normal times. So the current
readings are a very great distance away from being ‘normal’ and it
should take a good deal of time to get back to normal.
Diffusion increases do not necessarily mean that output
increases - When these diffusion indices rise, until they surpass a
reading of 50, they are indicating contraction at a slower pace but
still contraction and not expansion.. For now the PMIs are saying that
the worst – most severe phase of the contraction - is behind us, not
that recession is ending. And that is the message only if the December
bottoms stay in place and are not replaced by new weaker readings.
More weakness ahead - Rest ‘assured’ that more declines lies
ahead for conventional economic variables even if the diffusion indices
continue to rise from their lows.
Diffusing as Mr Sensitivity - Diffusion readings are very
valuable because they are so timely and because they are sensitive.
Formally the PMI indices are measures are gauges of the BREADTH not of
its strength. But everyone treats theses measure of breadth as if they
are of strength. Financial experts are well aware that is not so. For
stock markets analysts (for example) always looked at big ‘up’ or
‘down’ days in the stock indices to see if the breadth reinforced the
trend or not. Breadth in fact is not the same as strength – but they
are highly correlated. So again be careful how use diffusion data. They
often are the first whiff of slowdown or of bottoming. But they are
indicators and are not real economic variables so be careful how you
interpret them.
| FLASH Readings | ||
|---|---|---|
| Markit PMIs for the Euro Area | ||
| Markit PMIs for the Euro Area 15 | ||
| MFG | Services | |
| Jan-09 | 34.53 | 42.47 |
| Dec-08 | 33.87 | 42.06 |
| Nov-08 | 35.58 | 42.47 |
| Oct-08 | 41.10 | 45.76 |
| Averages | ||
| 3-Mo | 36.85 | 42.62 |
| 6-Mo | 41.74 | 45.19 |
| 12-Mo | 46.51 | 47.93 |
| 126-Mo Range | ||
| High | 60.47 | 62.36 |
| Low | 33.87 | 42.06 |
| % Range | 2.5% | 2.0% |

Tom Moeller
AuthorMore in Author Profile »Prior to joining Haver Analytics in 2000, Mr. Moeller worked as the Economist at Chancellor Capital Management from 1985 to 1999. There, he developed comprehensive economic forecasts and interpreted economic data for equity and fixed income portfolio managers. Also at Chancellor, Mr. Moeller worked as an equity analyst and was responsible for researching and rating companies in the economically sensitive automobile and housing industries for investment in Chancellor’s equity portfolio. Prior to joining Chancellor, Mr. Moeller was an Economist at Citibank from 1979 to 1984. He also analyzed pricing behavior in the metals industry for the Council on Wage and Price Stability in Washington, D.C. In 1999, Mr. Moeller received the award for most accurate forecast from the Forecasters' Club of New York. From 1990 to 1992 he was President of the New York Association for Business Economists. Mr. Moeller earned an M.B.A. in Finance from Fordham University, where he graduated in 1987. He holds a Bachelor of Arts in Economics from George Washington University.
More Economy in Brief


