 Global| Jun 05 2018
Composite PMIs Show Wear and Tear
Summary
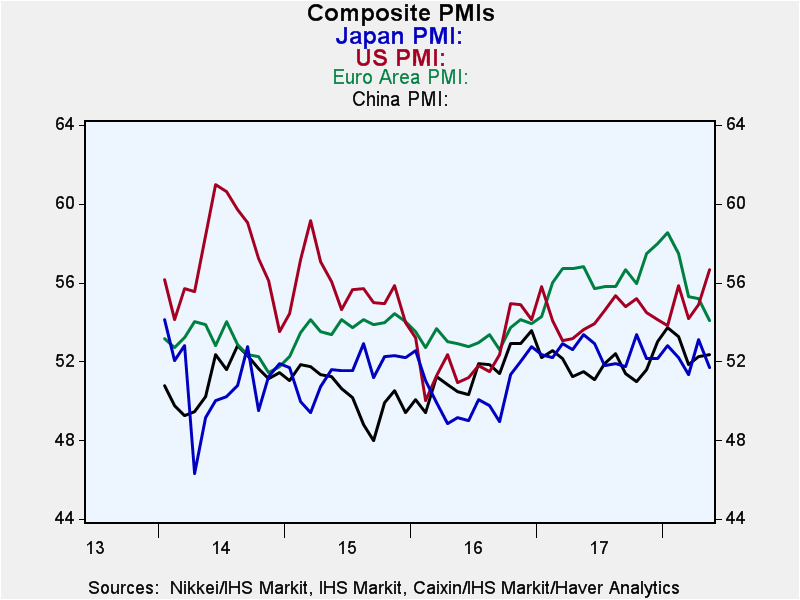
The services PMIs from Markit finalized today and with that the composite (or total) PMIs also finalized. EMU and its two largest member economies show weakened Composite PMI readings. Japan’s composite weakened. China’s composite was [...]
 The services PMIs from Markit finalized today and with that the composite (or total) PMIs also finalized. EMU and its two largest member economies show weakened Composite PMI readings. Japan’s composite weakened. China’s composite was steady, as its two sector indices, were unchanged. The US composite moved higher as manufacturing slipped and the services gauge moved higher. Within EMU Italy’s composite was unchanged and Spain’s was higher on a weaker manufacturing sector and stronger services.
EMU’s morphing in perspective
Earlier in this cycle the 5-plus year rankings of the EMU gauges were all extremely strong with high rankings in their 90th percentile for all four of the largest EMU economies. The only exception was even in the midst of strength the German service sector was lagging. Now the German service sector on a diffusion reading of 52.1 in May has a 5.7% percentile standing. It has been this low or lower less than 6% of the time in the last four and one-half years. While German manufacturing is still at a solid 71 percentile rank standing itself, the total or composite German PMI has a standing that has been weaker less than 10% of the time. Because of the weight of Germany in EMU the EMU service sector now has only a 50.9 percentile standing barely above its four and one-half year median value. EMU manufacturing has a percentile standing in its low 70th percentile range but its composite PMI reading is at a very modest 58.6 percentile queue standing.
In addition Italy has both composite and manufacturing standings that reside at or near the lower one-third of their respective historic queue of values. Europe suddenly displays a lot of moderation as well as outright weakness in its PMI readings.
However, we have to be careful using rankings to tell us how strong a PMI gauge is. A PMI value of 52 or 53 or 57 actually means nothing to us. And the percentile rankings only give the raw diffusion readings meaning over some selected time period. The gauges take on life and meaning when we compare them to where they have been historically. But five years of data is not enough to give us a decisive positioning.
Drilling down to China
Take China for example: China has been in a protracted slump. Its manufacturing PMI diffusion reading at 51.1, a rather low-seeming reading, has a percentile standing over the past four and one-half years in its 81st percentile- and that is relatively high standing for such a low raw diffusion reading. Together these metrics tell us not that manufacturing in China is strong but that manufacturing in China has been very weak, so weak that a reading of 51.1 garners an 81 queue percentile standing against that pale background. We can double check this prognosis by vetting it against a second China PMI that has a longer history. China’s second manufacturing PMI series is from The Federation of Logistics and Purchasing (TFLP). Its metric for May is 51.9 in that survey (instead of 51.1). That survey covers some 13 years. If we rank the 51.9 reading over 13 years it has a 58.6 percentile standing which sounds a bit more like it (than an 81 percentile standing). A reading of 51.1 in the longer TFLP series would have a 42 percentile standing (even weaker). However, looked at another way, the actual China Federation standing in May for the same period as the Markit readings produces a 96.2 percentile standing (even above the Markit 81st percentile standing)! This index confirms both that China is doing relatively well in this recent period and that against a broader background data China are not doing so well at all. Still, by the standards of the past four and one half years China is at least better.
The thrill is gone...
On balance PMI data are not very encouraging any more. There is still growth. There is much less momentum. For EMU and its largest members the composite PMIs are lower than their respective 12-month averages. That is true for Japan too. China is at its 12-Mo average while the US boasts a stronger composite that its 12-month average on above average readings for each sector, manufacturing and services. The global economy has lost all the momentum it was showing at the end 2017 while the US has greater gains. Will these trends continue as the Federal Reserve in the US raises rates?
Robert Brusca
AuthorMore in Author Profile »Robert A. Brusca is Chief Economist of Fact and Opinion Economics, a consulting firm he founded in Manhattan. He has been an economist on Wall Street for over 25 years. He has visited central banking and large institutional clients in over 30 countries in his career as an economist. Mr. Brusca was a Divisional Research Chief at the Federal Reserve Bank of NY (Chief of the International Financial markets Division), a Fed Watcher at Irving Trust and Chief Economist at Nikko Securities International. He is widely quoted and appears in various media. Mr. Brusca holds an MA and Ph.D. in economics from Michigan State University and a BA in Economics from the University of Michigan. His research pursues his strong interests in non aligned policy economics as well as international economics. FAO Economics’ research targets investors to assist them in making better investment decisions in stocks, bonds and in a variety of international assets. The company does not manage money and has no conflicts in giving economic advice.


