 Global| Feb 03 2004
Chain Store Sales Backpedal
by:Tom Moeller
|in:Economy in Brief
Summary
Chain store sales fell 1.3% last week, according to the ICSC-UBS survey, and gave back all of the prior week's 1.1% pop. Nevertheless, sales for the full month of January rose 1.6% versus December. During the last ten years there has [...]
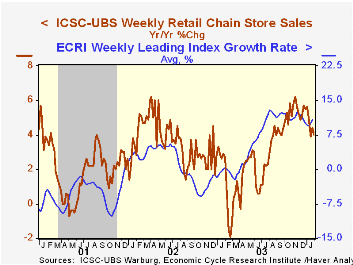
Chain store sales fell 1.3% last week, according to the ICSC-UBS survey, and gave back all of the prior week's 1.1% pop.
Nevertheless, sales for the full month of January rose 1.6% versus December.
During the last ten years there has been a 59% correlation between the year-to-year percent change in the ICSC-UBS measure of chain store sales and the change in non-auto retail sales less gasoline.
The ICSC-UBS retail chain-store sales index is constructed using the same-store sales reported by 78 stores of seven retailers: Dayton Hudson, Federated, Kmart, May, J.C. Penney, Sears and Wal-Mart.
| ICSC-UBS (SA, 1977=100) | 01/31/04 | 01/24/04 | Y/Y | 2003 | 2002 | 2001 |
|---|---|---|---|---|---|---|
| Total Weekly Retail Chain Store Sales | 425.3 | 430.9 | 4.0% | 2.9% | 3.6% | 2.1% |
by Tom Moeller February 3, 2004
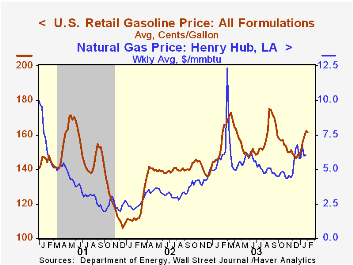
Retail gasoline prices held onto recent gains last week and settled at $1.62 per gallon. That was versus an average price of $1.57 in January and $1.48 in December.
Through the Fall, gasoline prices fell versus the peak of $1.75/gallon in late August.
Crude oil prices also backed up through yesterday to $34.98 for West Texas Intermediate crude (6.7% y/y) versus a low in late September below $27.00.
Wholesale natural gas prices remained higher at $6.11/mmbtu (13.4% y/y) in January versus a drop to $4.49 in November.
For the latest Short Term Energy Outlook from the US Department of Energy click here.
| US Retail Gasoline Prices | 02/02/04 | 12/29/03 | Y/Y | 2003 | 2002 | 2001 |
|---|---|---|---|---|---|---|
| All Formulations ($/Gal.) | $1.62 | $1.48 | 5.8% | $1.56 | $1.34 | $1.42 |
by Tom Moeller February 3, 2004
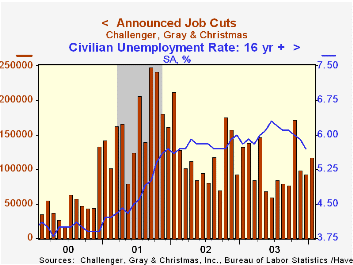
Announced job cuts in January rose 26.4% m/m according to Challenger, Gray & Christmas. Large increases in layoffs have often occurred in January, but this year announcements were lower than during January of 2003.
The three month moving average of job cut announcements fell to 103,343 (-19.0% y/y).
The increase in announced layoffs m/m was dominated by the financial, food, retail and transportation industries. Job cut announcements fell in most other industries.
Job cut announcements differ from layoffs in that many are achieved through attrition or just never occur.
During the last ten years there has been an 83% (inverse) correlation between the three month average level of announced job cuts and the y/y percent change payroll employment.
| Challenger, Gray & Christmas | Jan | Dec | Y/Y | 2003 | 2002 | 2001 |
|---|---|---|---|---|---|---|
| Announced Job Cuts | 117,556 | 93,020 | -11.1% | 1,236,426 | 1,431,052 | 1,956,876 |

Tom Moeller
AuthorMore in Author Profile »Prior to joining Haver Analytics in 2000, Mr. Moeller worked as the Economist at Chancellor Capital Management from 1985 to 1999. There, he developed comprehensive economic forecasts and interpreted economic data for equity and fixed income portfolio managers. Also at Chancellor, Mr. Moeller worked as an equity analyst and was responsible for researching and rating companies in the economically sensitive automobile and housing industries for investment in Chancellor’s equity portfolio. Prior to joining Chancellor, Mr. Moeller was an Economist at Citibank from 1979 to 1984. He also analyzed pricing behavior in the metals industry for the Council on Wage and Price Stability in Washington, D.C. In 1999, Mr. Moeller received the award for most accurate forecast from the Forecasters' Club of New York. From 1990 to 1992 he was President of the New York Association for Business Economists. Mr. Moeller earned an M.B.A. in Finance from Fordham University, where he graduated in 1987. He holds a Bachelor of Arts in Economics from George Washington University.
More Economy in Brief


