 Global| Mar 31 2009
Case-Shiller Home Price IndexFalls Further
by:Tom Moeller
|in:Economy in Brief
Summary
The January S&P/Case-Shiller 20 Home Price Composite Index fell 2.2% from December. That pulled prices down 19.0% during the last twelve months and by 29.1% since their peak in May 2006. The series dates back only to 2000. The January [...]
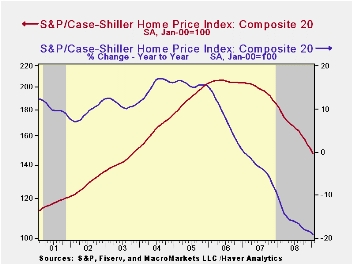
The January S&P/Case-Shiller 20
Home Price Composite Index fell 2.2% from December. That
pulled prices down 19.0% during the last twelve months and by 29.1%
since their peak in May 2006. The series dates back only to
2000. The January decline in prices was as expected.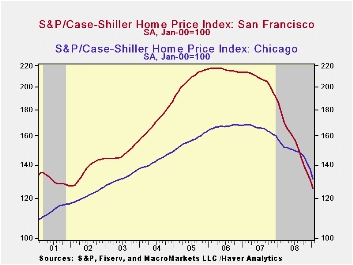
The S&P/Case-Shiller home price series can be found in Haver's USECON database but the city data is in the REGIONAL database.
The Case-Shiller index of 20 U.S. cities and their surrounding areas is weighted to reflect price changes due to extensive remodeling, home additions or extreme neglect. For example, smaller weights are assigned to sales of homes that have undergone extensive remodeling.
The Case-Shiller composite index of homes in 10 metropolitan areas, which has a longer history and dates back to 1987, fell 2.0% and was down 19.4% year-to-year. The measure was down 29.7% since the 2006 peak.
Weakest Regions: Home prices in Phoenix, Nevada were quite weak and fell 35.0% y/y and in San Diego prices fell 24.9% y/y, off 40.4% from their early 2006 peak. Home prices in Las Vegas, Nevada fell 32.5% y/y and were down 46.2% from their peak. Prices in Miami fell 29.4% y/y while home prices in Los Angeles were down 25.8% y/y. In San Francisco home prices were off 32.4% year-to-year. In Tampa they fell 23.3% and in Detroit home prices fell by 22.6% y/y.
Less Weak Regions: In the Northeast, the decline in home prices continued less severe. Prices in New York fell 9.6% y/y, off 16.2% from their 2006 peak. Prices were down 7.3% year-to-year in Boston and in Dallas prices were off by a modest 4.8% y/y and by 8.8% from the 2007 peak. In Charlotte, North Carolina prices fell a moderate 8.8% y/y and in Denver home prices prices fell just 5.1% y/y. In Cleveland, Ohio prices were off 5.1% y/y but in Chicago home prices were down a larger 16.4% y/y, 22.0% from the 2007 peak.
The latest press release from Standard & Poor's can be found here. An overview of the S&P/Case-Shiller home price series can be found here.
The Case-Shiller data is available in Haver's USECON database.
| S&P/Case-Shiller Home Price Index (SA, Jan 00 = 100) | January | December | Y/Y | 2008 | 2007 | 2006 |
|---|---|---|---|---|---|---|
| 20 City Composite Index | 147.45 | 150.75 | -19.0% | -15.8% | -3.8% | 7.6% |
Petroleum Prices Strengthen, Then Fall Back
by Tom Moeller March 31, 2009
Petroleum prices continued to rally last week as sentiment
continued to shift on the economy. Firmer data on U.S. consumer
spending, home sales & factory orders helped lift
crude oil prices to their highest level since last November.
For a barrel of West Texas Intermediate prices rose to $53.09, up more
than 50% from the December low of $32.37 per barrel. That bullish
economic sentiment reversed somewhat yesterday, however. In futures
trading the May contract price for crude oil fell back to $48.41 per
barrel. Prices reached a high of $145.66 last July.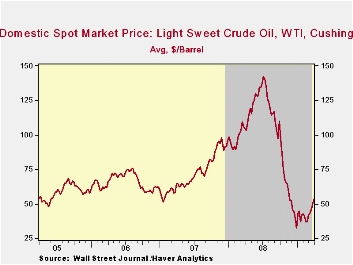
Regular gasoline prices followed the rise in crude and increased last week to $2.05 per gallon, also the highest level since last November. The latest was up 43 cents from the December low. Yesterday, the spot market price for regular gasoline turned with the drop in crude oil prices and fell nearly ten cents from Friday's level. These prices compare to those that were slightly below $1.00 at the end of last year. The figures are reported by the U.S. Department of Energy.
Weekly gasoline prices can be found in Haver's WEEKLY database. Daily prices are in the DAILY database.
The price effect on driving has been little changed. Gasoline demand continued to suffer due to the effects of the U.S. recession although earlier declines in gasoline prices have given some lift to driving. The latest y/y change of -0.4% moderated from the 4.8% rate of decline seen last October. (Gasoline prices at the time were just off their peak.) The change in demand is measured using the latest four weeks versus the same four weeks in 2008. Demand for all petroleum products was down 3.2% y/y. That negative comparison was led by a 10.1% decline in distillate demand and a 7.2% drop in residual fuel oil consumption. These numbers are available in Haver's OILWKLY database.
The price of natural gas continued downward with the coming end to the winter heating season. Though prices did tick up last week to $3.92 per mmbtu (-57.7% y/y) they still were near the lowest level since 2002. The latest average price was down more than two-thirds from the high reached in early-July of $13.19/mmbtu.
| Weekly Prices | 03/30/09 | 03/23/09 | Y/Y | 2008 | 2007 | 2006 |
|---|---|---|---|---|---|---|
| Retail Regular Gasoline ($ per Gallon, Regular) | 2.05 | 1.96 | -37.8% | 3.25 | 2.80 | 2.57 |
| Light Sweet Crude Oil, WTI ($ per bbl.) | 53.09 | 49.46 | -49.1% | 100.16 | 72.25 | 66.12 |
U.S. Consumer Confidence Stabilizes Near Record Low
by Tom Moeller March 31, 2009
 The Conference Board
reported that its March index of consumer confidence stabilized this
month near its record low level reached during February. The reading of
26.0 was roughly stable with February but it left confidence
three-quarters lower than the July 2007 peak. The latest figure was
slightly lower than Consensus expectations.
The Conference Board
reported that its March index of consumer confidence stabilized this
month near its record low level reached during February. The reading of
26.0 was roughly stable with February but it left confidence
three-quarters lower than the July 2007 peak. The latest figure was
slightly lower than Consensus expectations.
The Conference Board data can be found in Haver's CBDB database.
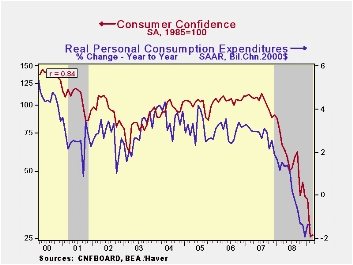
 During the
last ten years there has been an 86% correlation between the level of
consumer confidence and the y/y change in real consumer spending.
During the
last ten years there has been an 86% correlation between the level of
consumer confidence and the y/y change in real consumer spending.
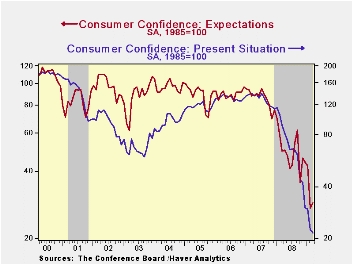
Consumers' economic outlook improved slightly as indicated by a higher expectations index, but the latest reading made up little of February's more than one-third decline from January. The latest figure also was off by more than one-half from last February. The percentage of respondents expecting business conditions to worsen in six months was little changed at 39.1%, near the highest since 1974. Just 9.1% expected improvement in conditions. More jobs were expected by only 7.1% of respondents. As a result of that jobs outlook a near-record 23.9% foresaw less income. That was versus 15.0% last year and just 8.6% in 2007.
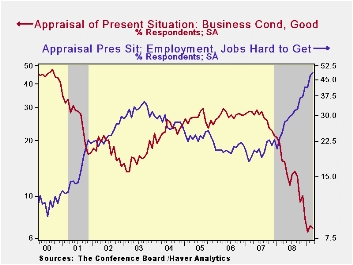
The present conditions index added 3.6% to the more-than one quarter February drop. It remained off more than three-quarters from a year earlier. Jobs were seen as hard to get by 48.7% of respondents, the highest (by just a bit) since 1992 and jobs were seen as plentiful by only 4.6%. Business conditions were seen as good by just 6.8% and that matched the 1991 low. Those who thought conditions were bad rose to 51.1%, the highest since 1983.
 Expectations
for the inflation rate in twelve months have been roughly stable since
November at 5.9%. That's down from last year's high of 7.7%.
Expectations about interest rates has started to sort out for an
increase with 35.6% of respondents expecting higher interest rates
while 29.7% expect rates to fall. A separate question indicated that a
near record 54.3% of respondents expected lower stock prices.
Expectations
for the inflation rate in twelve months have been roughly stable since
November at 5.9%. That's down from last year's high of 7.7%.
Expectations about interest rates has started to sort out for an
increase with 35.6% of respondents expecting higher interest rates
while 29.7% expect rates to fall. A separate question indicated that a
near record 54.3% of respondents expected lower stock prices.
The decline in overall consumer confidence over the last year has been greatest amongst higher income earners. It has been fairly uniform by age group.
| Conference Board (SA, 1985=100) | March | February | Y/Y % | 2008 | 2007 | 2006 |
|---|---|---|---|---|---|---|
| Consumer Confidence Index | 26.0 | 25.3 | -60.5 | 57.9 | 103.4 | 105.9 |
| Present Situation | 21.5 | 22.3 | -76.3 | 69.9 | 128.8 | 130.2 |
| Expectations | 28.9 | 27.3 | -52.6 | 50.0 | 86.4 | 89.7 |
Flash Dance - Inflation Waltzes to New Lows as Risk Soars to Dizzying Heights
by Robert Brusca March 31, 2009
 Fat Chance…
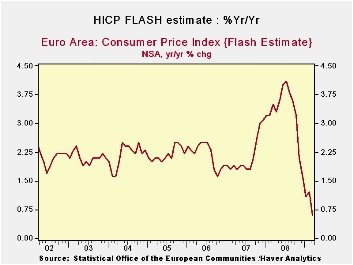
The EMU FLASH HICP is at an all time low skinny 0.6% gain
Yr/Yr. If it were human we’d say it is anorexic. Italy also got on the
board with a weak HICP, posting the lowest reading since ‘Ed Sullivan’
and ‘Leave it to Beaver’ were first run shows. (roughly 1968).
Gooey Good News
Despite al this gooey good news the pace of inflation’s drop
actually is slowing, not speeding up. The Yr/Yr at 0.6% is higher than
the six month pace of -1.4% but then over three-months the pace
flattens at 0%. Core inflation is still stepping down. But we know what
is going on and what is driving these trends. Headline inflation is
driven by food and energy and in this cycle energy has taken the wheel,
not some deity. Spot oil prices had collapsed but the have climbed back
to the vicinity of $50.bbl. It is hard to tell where oil goes short
term, but prices are the up from their lowest, meaning headline
inflation will perform that same magic trick.
Peak oil not an issue now…
In broader terms inflation is clearly under control. When the
world economy grows again there will once again be all those questions
about peak oil or not. China is a new factor underpinning demand. But
we can put those questions off for a while.
Reality bites and the OECD worries
For now, and for some time to come, inflation seems to be
under control. The big news on our plate is the G-20 meeting and how
policy will respond to the current diverse challenges. The OECD
introduced a series of forecasts ahead of this meeting that have gotten
even glummer. The OECD is urging more stimulus as a result. All this is
going to put more pressure on the ECB to move rates lower, especially
with Euro-stimulus policy in the shape it’s in. The summit seems to be
a done deal as euro-stubbornness has won out. In addition French
intransigence is trying to make headway as France has threatened to
boycott if the regulation proposals are not enacted. Summit policy is
always pre-determined but it isn’t always this clear.
Policy options are alive…but not well…not even good
All in all it is not really surprising with such economic
weakness to find inflation is under control. That development puts more
leeway in the hands of policymakers. But what happens when they refuse
to take up the opportunity? Europe admits its 200bln euro plan will not
have much impact until 2010. That was Junker’s contribution to the
discussion today as the OECD ramped up the bad news. The US seems to be
living in a different world where action is required while Europe sits
back to watch. Some of this is that Europe already has a better social
safety net than the US. But that is ‘cushion’ and what the world needs
now is ‘stimulus,’ sweet stimulus. But it’s not happening in London.
London 2009 will make the same mistake as London 1977. It will reject a
chance for more stimulus and stretch out the pain. If London 1977 is a
learning experience, it launched Bonn 1978 and the result was that too
much stimulus was enacted too late. I hope that is not our true path.
On the other hand part of me says, ‘Fat chance’.
| Trends in EMU HICP: Flash Index | |||||||
|---|---|---|---|---|---|---|---|
| % mo/mo | % SAAR | ||||||
| Mar-09 | Feb-09 | Jan-09 | 3-Mo | 6-Mo | 12-Mo | Yr Ago | |
| EMU-13 | -0.1% | 0.3% | -0.2% | 0.0% | -1.4% | 0.6% | 3.6% |
| Core | #N/A | 0.2% | -0.2% | 0.6% | 1.1% | 1.7% | 2.4% |
| Goods | #N/A | 0.3% | -1.2% | -6.3% | -3.2% | 0.3% | 3.8% |
| Services | #N/A | 0.5% | -0.4% | 3.9% | 0.6% | 2.4% | 2.5% |
| HICP | |||||||
| Germany | -0.2% | 0.3% | 0.0% | 0.4% | -1.3% | 0.4% | 3.3% |
| France | #N/A | 0.3% | -0.1% | -0.3% | -1.0% | 1.0% | 3.2% |
| Italy | 0.0% | 0.4% | -0.6% | -0.7% | -0.9% | 1.0% | 3.5% |
| Spain | #N/A | 0.2% | -0.4% | -2.4% | -2.7% | 0.7% | 4.4% |
| Core excl Food Energy & Alcohol | |||||||
| Germany | #N/A | 0.4% | -0.1% | 1.5% | 0.8% | 1.2% | 2.2% |
| Italy | #N/A | 0.5% | -0.6% | 0.4% | 1.1% | 2.2% | 2.4% |
| Spain | #N/A | -0.2% | -0.2% | -1.3% | -0.1% | 1.6% | 3.3% |
| Blue shaded area data trail by one month | |||||||
Turkey -- Another Emerging Economy Reports A Dismal 4Th Quarter Gross Domestic Product
by Louise Curley March 31, 2009
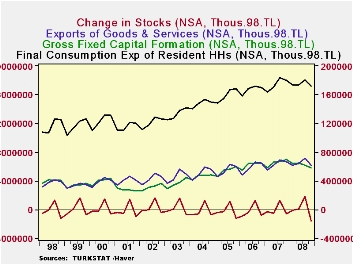
Fourth quarter Turkish Gross Domestic Product, released today, declined on a seasonally adjusted basis 4.9% from the third quarter continuing the declines of 3.6% and 1.7% in the second and third quarters, respectively. For the year as a whole, GDP increased only 1.1%, the lowest annual increase since 2001.
There were two factors having a positive effect on GDP in the
last three quarters of the year that were actually suggesting weakness
in the economy. The decline in imports of 1.4 billion lira from
7.6.billion lira in the first quarter to 6.2 billion lira in the last
quarter affected GDP positively, but it suggested weakness in consumer
and business demand. The other was the increase in inventories in the
first three quarters of the year, which, again, had a positive effect
on GDP, but was beginning to reflect the piling up of unsold goods
rather than the piling up of goods in response to vigorous demand. The
major factors affecting GDP--consumption expenditures, gross fixed
capital formation, exports and changes in stocks--are show in the first
chart.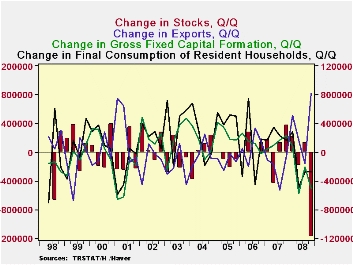
The magnitude of the fourth quarter decline in total GDP was largely due to a sharp decline in stocks as can be seen in the second chart which shows the changes in consumption expenditures, gross capital formation, exports, and stocks.
Inflation, in Turkey, as measured by the year to year increase in the GDP deflator rose steadily through the year and was 10.1% in the fourth quarter. In spite of the rise in inflation, the Central Bank of Turkey concluded that the weakness in the economy was more important than inflation and reduced its Policy rate--the overnight borrowing rate--from 16.25% in October to 10.50% currently.
| TURKEY ACCOUNT (100 Mil Yen) | Q4 08 | Q3 08 | Q2 08 | Q1 08 |
|---|---|---|---|---|
| Total GDP (NSA) Y/Y %chg | -6.17 | 1.19 | 2.75 | 7.33 |
| Household Consumption | -4.62 | -1.25 | 1.54 | 6.07 |
| Gross Fixed Capital Formation | -17.48 | -6.89 | -1.16 | 9.55 |
| Imports | -23.05 | -2.79 | 2.25 | 14.94 |
| Exports | 8.21 | 3.59 | 38.7 | 13.27 |
| Stocks | -1613535 | 1286937 | 92754 | -69591 |
| Total GDP (SA) Y/Y %chg | -4.87 | -1.70 | -3.58 | 4.10 |
| Household Consumption | -2.55 | -1.18 | -1.57 | 0.67 |
| Gross Fixed Capital Formation | -8.22 | -3.36 | -8.41 | 1.16 |
| Imports | -18.02 | -0.11 | -8.86 | 2.80 |
| Exports | -8.13 | -2.62 | -7.87 | 11.37 |
| Stocks | -824576 | 360674 | 233648 | 426821 |

Tom Moeller
AuthorMore in Author Profile »Prior to joining Haver Analytics in 2000, Mr. Moeller worked as the Economist at Chancellor Capital Management from 1985 to 1999. There, he developed comprehensive economic forecasts and interpreted economic data for equity and fixed income portfolio managers. Also at Chancellor, Mr. Moeller worked as an equity analyst and was responsible for researching and rating companies in the economically sensitive automobile and housing industries for investment in Chancellor’s equity portfolio. Prior to joining Chancellor, Mr. Moeller was an Economist at Citibank from 1979 to 1984. He also analyzed pricing behavior in the metals industry for the Council on Wage and Price Stability in Washington, D.C. In 1999, Mr. Moeller received the award for most accurate forecast from the Forecasters' Club of New York. From 1990 to 1992 he was President of the New York Association for Business Economists. Mr. Moeller earned an M.B.A. in Finance from Fordham University, where he graduated in 1987. He holds a Bachelor of Arts in Economics from George Washington University.
More Economy in Brief


