 Global| Oct 20 2004
Canadian Leading Indicators Rise, But More Slowly
Summary
The Canadian economy is strengthening or slowing according to divergent interpretations of today's September report on leading indicators. In releasing the report, Statistics Canada emphasized a progressive slowing in the indicator's [...]
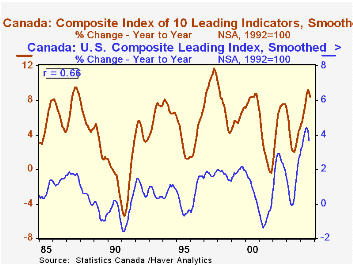
The Canadian economy is strengthening or slowing according to divergent interpretations of today's September report on leading indicators. In releasing the report, Statistics Canada emphasized a progressive slowing in the indicator's growth rates; from a 1.0% rise in June, the smoothed index increased in succeeding months by smaller and smaller amounts, gaining just 0.3% in September. StatCan also noted that only six of the 10 components contributed positively, the smallest number since May 2003. At the same time, traders in Canadian markets are encouraged by the simple fact that growth is continuing. This is evidenced by an uptrend in the Canadian dollar; yesterday, ahead of today's data, of course, the currency reached C$1.2569/US$, or US$0.7956/C$, the highest since mid-November 1992. Stock prices are also rising.
"It can't last", suggest Canadian officials. They point to the leading index component exerting the most pressure this month, the US leading indicator index, which enters as with a flat performance. That index is a smoothed and rebased version of the Conference Board index published here. In compiling the Canadian index, StatCan analysts insert the latest values of component data, even if they are a month or two old. Thus, the performance of the Canadian index for September includes the US index for August.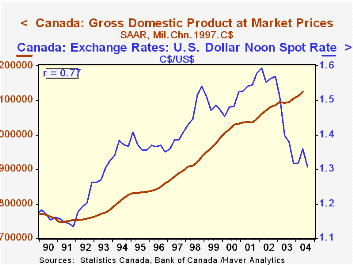
And ironically, the very strength in the Canadian currency that reflects traders' confidence in current growth patterns could be the very undoing of those patterns as the strong currency makes exports more expensive. However, the constraining relationship of the currency and Canadian GDP can't really be counted on. There is a close correlation, -87%, between the level of GDP and the level of the Canadian dollar/US dollar exchange rate since 1970. But over short time spans, that goes down considerably. Since 1990, the correlation is -66% and over the last ten years, -43%. The very most recent path of the currency should be pointing to a sharp slowing of the economy; but if that reflected genuine expectations about the economy, the currency would falter and badly so. So rules of thumb don't always give clear guidance.
| Sept 2004 | Aug 2004 | Jul 2004 | Year Ago | December/December||||
|---|---|---|---|---|---|---|---|
| 2003 | 2002 | 2001 | |||||
| Leading Indicator, smoothed (1992=100) | 199.9 | 199.3 | 198.4 | 184.4 | 188.4 | 179.8 | 167.4 |
| % Change | 0.3 | 0.5 | 0.7 | 8.4 | 4.8 | 7.4 | 0.2 |
| US Leading Indicator, smoothed, % Change | 0.0 | 0.2 | 0.3 | 3.7 | 2.8 | 1.7 | 0.6 |
| Can $, Index against C-6, % Change | 1.9 | 0.9 | 2.6 | 4.8 | 16.3 | -0.2 | 2.8 |
Carol Stone, CBE
AuthorMore in Author Profile »Carol Stone, CBE came to Haver Analytics in 2003 following more than 35 years as a financial market economist at major Wall Street financial institutions, most especially Merrill Lynch and Nomura Securities. She had broad experience in analysis and forecasting of flow-of-funds accounts, the federal budget and Federal Reserve operations. At Nomura Securities, among other duties, she developed various indicator forecasting tools and edited a daily global publication produced in London and New York for readers in Tokyo. At Haver Analytics, Carol was a member of the Research Department, aiding database managers with research and documentation efforts, as well as posting commentary on select economic reports. In addition, she conducted Ways-of-the-World, a blog on economic issues for an Episcopal-Church-affiliated website, The Geranium Farm. During her career, Carol served as an officer of the Money Marketeers and the Downtown Economists Club. She had a PhD from NYU's Stern School of Business. She lived in Brooklyn, New York, and had a weekend home on Long Island.
More Economy in Brief


