 Global| Mar 17 2005
Canadian Asset Growth Outstrips Liabilities in 2004, A Fundamental Improvement Supporting Currency Value
Summary
Canada's overall financial condition improved markedly in 2004, according to National Balance Sheet data report today by Statistics Canada. Total assets grew 5.7% and nonfinancial assets also grew 5.7%, both more than in 2003. [...]
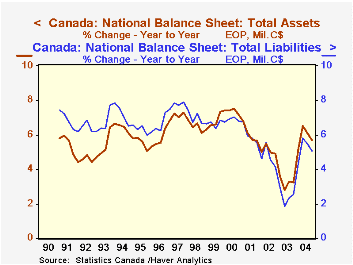
Canada's overall financial condition improved markedly in 2004, according to National Balance Sheet data report today by Statistics Canada. Total assets grew 5.7% and nonfinancial assets also grew 5.7%, both more than in 2003. Nonfinancial assets include buildings, equipment, consumer durable goods and the value of land; this sum is also known as "national wealth". Total liabilities expanded by 5.1%, more than the year before, but less than assets. So the difference, a measure of net worth for the entire economy, grew by 6.9% to nearly C$4.4 trillion. These data are all contained in Haver's CANSIM database.
Total assets in Canada have grown more rapidly than total liabilities since the middle of 1999, as seen in the first chart. Growth of both slowed with sagging share values and the slowdown in activity during 2001, but assets have remained on a stronger uptrend than liabilities. Nonfinancial assets have increased at a higher rate than liabilities since 2002.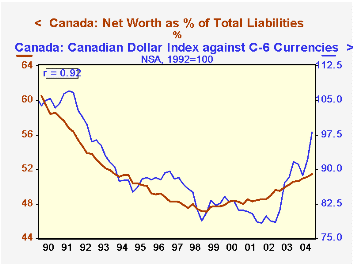
These overall relationships in the Canadian economy and financial system have an interesting relationship to the value of the Canadian currency. The second chart shows a substantial 92% correlation between the ratio of net worth to total liabilities and an index of the Canadian dollar against six other currencies. This ratio may be seen as an indication of leverage: how big is the role of debt in financing macroeconomic activity the nation. It seems intuitive that such a fundamental measure of economic conditions might influence the currency value. In the last couple of years, the weakness of the US dollar may have dominated as a determinant of the exchange rate. Even so, through the 15-year history of the balance sheet data, it is fascinating that the Canadian dollar weakened as long as net worth deteriorated relative to borrowing, but has tended higher since that ratio turned upward in 1999.
| Canada Billions Canadian $ |
2004 | 2003 | 2002 | 2001 | 2000 |
|---|---|---|---|---|---|
| Total Assets | 12,865.0 | 12,171.0 | 11,789.5 | 11,240.1 | 10,636.2 |
| % Change | 5.7 | 3.2 | 4.9 | 5.7 | 7.2 |
| Nonfinancial Assets (National Wealth) | 4,420.8 | 4,182.2 | 3,977.6 | 3,747.6 | 3,559.9 |
| % Change | 5.7 | 5.1 | 6.1 | 5.3 | 5.2 |
| Total Liabilities* | 8,495.4 | 8,084.8 | 7,883.4 | 7,572.1 | 7,174.6 |
| % Change | 5.1 | 2.6 | 4.1 | 5.5 | 6.8 |
| Net Worth (Assets - Liabilities) | 4,369.5 | 4,086.2 | 3,906.1 | 3,668.0 | 3,461.7 |
| % Change | 6.9 | 4.6 | 6.5 | 6.0 | 7.9 |
Carol Stone, CBE
AuthorMore in Author Profile »Carol Stone, CBE came to Haver Analytics in 2003 following more than 35 years as a financial market economist at major Wall Street financial institutions, most especially Merrill Lynch and Nomura Securities. She had broad experience in analysis and forecasting of flow-of-funds accounts, the federal budget and Federal Reserve operations. At Nomura Securities, among other duties, she developed various indicator forecasting tools and edited a daily global publication produced in London and New York for readers in Tokyo. At Haver Analytics, Carol was a member of the Research Department, aiding database managers with research and documentation efforts, as well as posting commentary on select economic reports. In addition, she conducted Ways-of-the-World, a blog on economic issues for an Episcopal-Church-affiliated website, The Geranium Farm. During her career, Carol served as an officer of the Money Marketeers and the Downtown Economists Club. She had a PhD from NYU's Stern School of Business. She lived in Brooklyn, New York, and had a weekend home on Long Island.
More Economy in Brief


