 Global| Jul 19 2006
Building Plans Moderate in South Africa, but Recent Strength Puts Plans Well Ahead of Completions
Summary
As the following charts and table illustrate, there's been something of a building boom in South Africa. Over the last few months, however, some areas of construction have been slowing. Statistics South Africa reported today that [...]
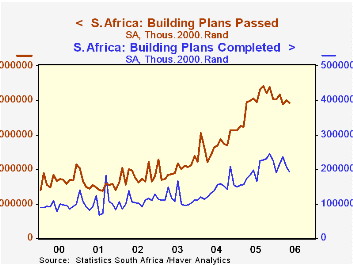
As the following charts and table illustrate, there's been something of a building boom in South Africa. Over the last few months, however, some areas of construction have been slowing.
Statistics South Africa reported today that total building plans passed declined in May to ZAR 3.92 billion from ZAR 4.00 billion in April (seasonally adjusted, 2000 prices. "ZAR" is the ISO code for the South African Rand). This amount is 3.2% below May 2005. This collection of data begins in 2000 and remains relatively erratic, so caution should be used in assessing just one month's figures. Indeed, Statistics South Africa highlights 3-month moving averages and year-to-date data in its press releases.
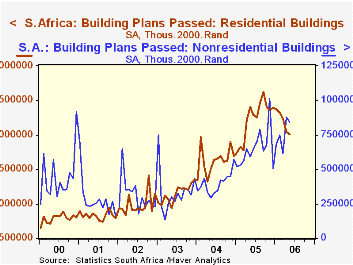 By type, there is an emerging downtrend in residential construction, while nonresidential building remains strong. Additions and alterations have been fairly steady. In the residential sector, small houses (under 80 square meters, about 861 square feet) are quite vigorous, with a 6-month moving average ending May up 70% from a year ago. Larger houses, though, are trailing off: in May the 6-month average was up 9.2% year-on-year, but a 3-month average was up only 4.1%.
Within the nonresidential sector, data are available not seasonally adjusted in nominal terms for offices, shopping centers, and industrial and warehouse structures. Perhaps in line with the residential sector's general slowing, shopping space construction plans have been flat now for about six months. Offices and banks, though, are still advancing, and industrial and warehousing facilities were up in May by nearly 63% from a year ago, based on 3-month average figures. This is large, but considerably more moderate than the 100%+ pace that characterized the latter part of 2005.
These are building "plans". With the recent surge in plans, many projects, especially nonresidential buildings will take some time for the construction. Thus, buildings completed, a separate measure, is much smaller than the plans figure. In May, a 3-month average of that total (seasonally adjusted) was ZAR 2.12 billion, up 23.9% from May 2005.
| South Africa: SA, Mil.2000.Rand |
May 2006 | Apr 2006 | Mar 2006 | Year Ago | Monthly Averages|||
|---|---|---|---|---|---|---|---|
| 2005 | 2004 | 2003 | |||||
| Building Plans Passed | 3925 | 4001 | 3886 | 3996 | 3912 | 2707 | 2013 |
| Residential | 2006 | 2048 | 2227 | 2403 | 2230 | 1624 | 1146 |
| Nonresidential | 847 | 881 | 613 | 591 | 651 | 395 | 334 |
| Additions & Alterations | 1072 | 1072 | 1046 | 1002 | 1031 | 688 | 533 |
| Buildings Completed | 1915 | 2064 | 2371 | 1884 | 1943 | 1417 | 1147 |
Carol Stone, CBE
AuthorMore in Author Profile »Carol Stone, CBE came to Haver Analytics in 2003 following more than 35 years as a financial market economist at major Wall Street financial institutions, most especially Merrill Lynch and Nomura Securities. She had broad experience in analysis and forecasting of flow-of-funds accounts, the federal budget and Federal Reserve operations. At Nomura Securities, among other duties, she developed various indicator forecasting tools and edited a daily global publication produced in London and New York for readers in Tokyo. At Haver Analytics, Carol was a member of the Research Department, aiding database managers with research and documentation efforts, as well as posting commentary on select economic reports. In addition, she conducted Ways-of-the-World, a blog on economic issues for an Episcopal-Church-affiliated website, The Geranium Farm. During her career, Carol served as an officer of the Money Marketeers and the Downtown Economists Club. She had a PhD from NYU's Stern School of Business. She lived in Brooklyn, New York, and had a weekend home on Long Island.
More Economy in Brief


