 Global| Nov 01 2004
Australian Exports Continue Trend Toward More Asian Orientation and Commodity Prices Reflect Relative Demands of [...]
Summary
Export data released today show that the trend that began in early 2003 toward increased Australian exports to Asia relative to the US and Europe has continued. In September, 2004, exports to Asian countries were significantly above [...]
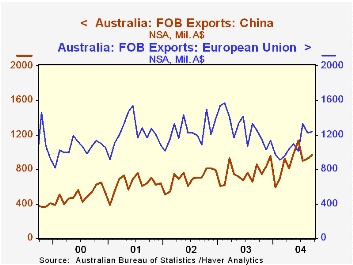
Export data released today show that the trend that began in early 2003 toward increased Australian exports to Asia relative to the US and Europe has continued. In September, 2004, exports to Asian countries were significantly above the monthly average of 2003, while exports to the European Union and the United States were only moderately above the monthly average for 2003. Chart 1 shows exports to China versus those to the European Union.
In terms of the types of commodities exported, Australia is now exporting fewer of its agricultural natural resources and more of its vast store of nonagricultural natural resources. Much of the shift is due to the rapid industrialization of China with its demands for such base materials as copper, nickel, lead and zinc and iron ore, coal and liquid natural gas.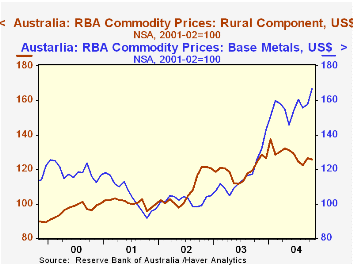
The increased demand for base metal and nonrural commodities relative to that of rural commodities is reflected in the relative prices as shown in Chart 2.
| Exports (Millions A$) | Sep 04 | Aug 04 | Sep 03 | M/M % |
Y/Y % |
2003 Mo Avg | 2002 Mo Avg | 2001 Mo Avg |
|---|---|---|---|---|---|---|---|---|
| Rural Goods 1 | 2352 | 2287 | 1858 | 2.84 | 26.59 | 1866 | 2407 | 2538 |
| Non-rural Goods 2 | 8092 | 7745 | 6882 | 4.47 | 17.58 | 7190 | 7553 | 7730 |
| To China | 961 | 921 | 857 | 4.34 | 12.64 | 757 | 697 | 632 |
| Japan | 2076 | 2073 | 1631 | 0.14 | 27.28 | 1640 | 1848 | 1977 |
| ASEAN | 1234 | 1157 | 898 | 7.43 | 38.42 | 1008 | 1215 | 1282 |
| EU | 1235 | 1225 | 1257 | 0.82 | -1.75 | 1283 | 1243 | 1228 |
| US | 811 | 845 | 709 | -4.02 | 14.39 | 787 | 962 | 993 |
| Reserve Bank of Australia-Index of Commodity Prices (Jul 2000 to Jun 2001=100) |
Oct 04 | Sep 04 | Oct 03 | M/M % |
Y/Y % |
2003 Mo Avg | 2002 Mo Avg | 2001 Mo Avg |
| Base Metals | 119 | 117.8 | 94.9 | 1.02 | 25.40 | 93.8 | 98.3 | 106.1 |
| Rural Component | 89.7 | 94.3 | 93.5 | -4.88 | -4.06 | 96.1 | 103.9 | 101.8 |
| Non-rural Component | 100.7 | 102.7 | 82.8 | -1.95 | 21.62 | 85.8 | 96.2 | 100.0 |
More Economy in Brief


