 Global| Nov 30 2004
A Spate of New Data from Japan: Most of It Disappointing
Summary
With the Japanese economy having increased a mere 0.1% in the third quarter, October data will be scrutinized for signs indicating whether the economy has merely paused or it has entered a down trend. Today, data on industrial [...]
With the Japanese economy having increased a mere 0.1% in the third quarter, October data will be scrutinized for signs indicating whether the economy has merely paused or it has entered a down trend. Today, data on industrial production, incomes and expenditures of families of household workers, the unemployment rate, exports and imports have been released by the Japanese government. In additionNTC Research has released its PMI for manufacturing in Japan in November. Most of the data are disappointing.
Industrial Production fell 1.59% in October from September. The NTC Research Purchasing Managers Survey declined in November to 51.27 from, 52.95 in October--not a good omen for future production.
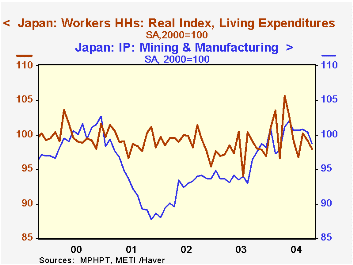
With declines in real pre tax and after tax incomes of, 2.74% and 2.61%, respectively and with a one percentage point rise in the unemployment rate, families of household workers cut back on their real spending by 1.21% in November from October. Their spending, moreover, was even below, if only slightly, the corresponding month of last year. (Industrial production and the expenditures of families of workers are shown in the attached chart.
The one bright spot was an increase in exports of 3.12%. However, imports on a year-over-year basis continue to rise sharply, largely as a result of imports of petroleum and related products, including coal, Liquid Petroleum Gas (LPG) and Liquid Natural Gas (LNG).
| Oct 04 | Sep 04 | Oct 03 | M/M % |
Y/Y % |
2003 | 2002 | 2001 | |
|---|---|---|---|---|---|---|---|---|
| Worker Households, Real Indexes (2000=100) | ||||||||
| Income | 95.8 | 98.5 | 96.4 | -2.74 | -0.62 | 95.6 | 98.1 | 99.1 |
| Disposable income | 97.0 | 99.6 | 97.4 | -2.61 | -0.41 | 95.6 | 97.8 | 99.1 |
| Living expenditures | 98.0 | 99.2 | 98.1 | -1.21 | -0.10 | 97.9 | 99.0 | 99.2 |
| Unemployment Rate % | 4.7 | 4.6 | 5.2 | 0.1* | -0.5* | 5.3 | 5.4 | 5.0 |
| Industrial Production (2000=100) | 98.8 | 100.4 | 97.5 | -1.59 | 1.33 | 95.1 | 92.0 | 93.2 |
| Exports (Tril. Yen) | 5283.9 | 5124.1 | 4653.4 | 3.12 | 13.55 | 54548.1 | 52141.9 | 49086.3 |
| Imports (Tril. Yen) | 4431.7 | 4312.8 | 3684.0 | 2.76 | 20.30 | 44349.7 | 42229.4 | 42346.2 |
| Mineral Fuels | 975.5 | 932.3 | 678.1 | 4.64 | 43.85 | 9349.9 | 8173.9 | 8523.7 |
| Balance (Tril. Yen) | 852.2 | 811.3 | 969.41 | 5.04 | -12.10 | 10198.4 | 9912.5 | 6740.1 |
More Economy in Brief


