 Global| Nov 10 2004
A Shallower U.S. Trade Deficit in September
by:Tom Moeller
|in:Economy in Brief
Summary
The U.S. foreign trade deficit eased to $51.6B in September from the near record $53.5B in August which was revised shallower due to higher exports. Consensus expectations had been for a deficit of $54.0B. Total exports grew 0.8% for [...]
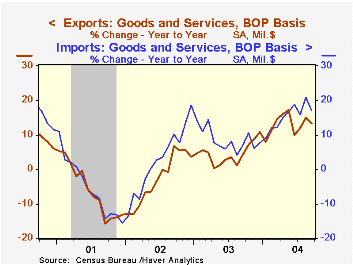
The U.S. foreign trade deficit eased to $51.6B in September from the near record $53.5B in August which was revised shallower due to higher exports. Consensus expectations had been for a deficit of $54.0B.
Total exports grew 0.8% for the second month (+13.3% y/y). Goods exports jumped 1.4% (15.0% y/y) due to broad gains but higher exports of foods & beverages stole the show with a 15.3% m/m gain (+4.0% y/y).
Non auto consumer goods exports also were strong for the second month with a 2.9% (+14.9% y/y) gain and capital goods export rose 1.0% (12.8% y/y).
Total imports fell for the second month in the last three, down 0.8% (17.1% y/y) as petroleum imports fell 4.3% (+42.8% y/y) despite a rise in crude oil prices to an average $37.62/bbl. Crude oil prices rose another $6.00/bbl in October but have since retraced all of that gain. The quantity of energy related petroleum products fell 9.7% in September -1.3% y/y).
Imports of non-petroleum goods rose 0.2% (15.3% y/y). In constant 2000$ nonpetroleum imports fell 0.1% (+15.5% y/y). Foods imports fell 2.6% (+3.7% y/y as did "other" imports by 5.9%. Capital goods imports rose 1.4% (17.6% y/y) but nonauto consumer goods imports fell 0.1% (+9.2% y/y, down for the fifth consecutive month.
The US trade deficit with China deepened to another record of $15.5.0B ($124.1B in 2003). Year over year, exports to China rose 36.6% and imports rose 24.6%. The US trade deficit with Japan eased to $6.1B ($66.0B in 2003) as did the deficit with the European Union which eased to $7.7B ($97.9B in 2003).
"Reflections on China's Economy" from the Federal Reserve Bank of San Francisco is available here.
"Exchange Rate Movements and the U.S. International Balance Sheet" from the Federal Reserve Bank of San Francisco can be found here.
| Foreign Trade | Sept | Aug | Y/Y | 2003 | 2002 | 2001 |
|---|---|---|---|---|---|---|
| Trade Deficit | $51.6B | $53.5B | $41.3B(9/03) | $496.5B | $421.7B | $362.7B |
| Exports - Goods & Services | 0.8% | 0.8% | 13.3% | 4.6% | -3.1% | -6.0% |
| Imports - Goods & Services | -0.8% | 2.6% | 17.1% | 8.5% | 2.1% | -5.5% |

Tom Moeller
AuthorMore in Author Profile »Prior to joining Haver Analytics in 2000, Mr. Moeller worked as the Economist at Chancellor Capital Management from 1985 to 1999. There, he developed comprehensive economic forecasts and interpreted economic data for equity and fixed income portfolio managers. Also at Chancellor, Mr. Moeller worked as an equity analyst and was responsible for researching and rating companies in the economically sensitive automobile and housing industries for investment in Chancellor’s equity portfolio. Prior to joining Chancellor, Mr. Moeller was an Economist at Citibank from 1979 to 1984. He also analyzed pricing behavior in the metals industry for the Council on Wage and Price Stability in Washington, D.C. In 1999, Mr. Moeller received the award for most accurate forecast from the Forecasters' Club of New York. From 1990 to 1992 he was President of the New York Association for Business Economists. Mr. Moeller earned an M.B.A. in Finance from Fordham University, where he graduated in 1987. He holds a Bachelor of Arts in Economics from George Washington University.
More Economy in Brief


