 Global| Nov 26 2002
3Q GDP Growth Revised Up
by:Tom Moeller
|in:Economy in Brief
Summary
Real GDP last quarter was revised up more than Consensus expectations for a revision to 3.6% growth. Year to date growth in real GDP has been 3.4% (AR). The effect from inventory accumulation was raised notably, adding nearly one half [...]

Real GDP last quarter was revised up more than Consensus expectations for a revision to 3.6% growth. Year to date growth in real GDP has been 3.4% (AR).
The effect from inventory accumulation was raised notably, adding nearly one half of a percentage point to growth, as production was stronger than estimated initially.
Corporate profits after tax were strong, rising 8.7%, though they were still down 1.0% y/y. Profits with IVA & CCA fell 7.0% (+12.2% y/y), the third consecutive down quarter. Tax law changes greatly boosted the Capital Consumption Adjustment (depreciation) as of 4Q01. The CCA has fallen sharply since the 4Q peak.
Domestic final demand growth was revised slightly higher led by an upward revision to residential investment, revised to show a 2.1% increase rather than the decline reported initially. Personal consumption growth was revised to 4.1%.
Capital spending declined 0.7% instead of rising 0.6% as reported initially. The decline in business spending on structures was deepened to 20.6%. Spending on equipment was revised up slightly to 6.6% as a result of a raised estimate of spending on information processing equipment & software (14.4%).
The trade sector's contribution to growth was revised up slightly to zero as export growth was raised to 3.3% (2.5% y/y). Import growth was little changed at 2.3% (6.5% y/y).
Estimated inflation was little changed and down slightly from 1Q02.
| Chained '96 $, % AR | 3Q'02 (Prelim.) | 3Q'02 (Advance) | 2Q'02 (Final) | Y/Y | 2001 | 2000 | 1999 |
|---|---|---|---|---|---|---|---|
| GDP | 4.0% | 3.1% | 1.3% | 3.2% | 0.3% | 3.8% | 4.1% |
| Inventory Effect | 0.4% | -0.1% | 1.3% | 0.7% | -1.2% | 0.1% | -0.2% |
| Final Sales | 3.5% | 3.2% | -0.1% | 2.5% | 1.5% | 3.7% | 4.3% |
| Trade Effect | 0.0% | -0.1% | -1.4% | -0.5% | -0.1% | -0.6% | -0.9% |
| Domestic Final Demand | 3.4% | 3.2% | 1.3% | 3.0% | 1.6% | 4.3% | 5.2% |
| Chained GDP Price Deflator | 1.0% | 1.1% | 1.2% | 0.8% | 2.4% | 2.1% | 1.4% |
by Tom Moeller November 26, 2002
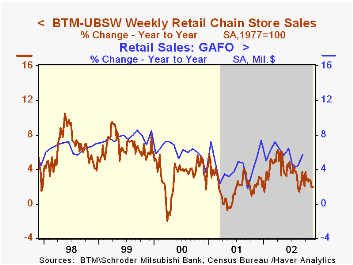
Chain store sales rose 0.9% last week according to the BTM-UBSW survey. The rise recouped some of the 1.2% drop the prior week.
With the important Thanksgiving week to go, November sales were down 0.2% from the average sales level a month earlier. October sales fell 1.5% from September.
During the last ten years there has been a 48% correlation between the year-to-year percent change in monthly chain store sales and the change in GAF retail sales.
| BTM-UBSW (SA, 1977=100) | 11/23/02 | 11/16/02 | Y/Y | 2001 | 2000 | 1999 |
|---|---|---|---|---|---|---|
| Total Weekly Retail Chain Store Sales | 400.8 | 397.1 | 2.0% | 2.1% | 3.4% | 6.7% |
by Tom Moeller November 26, 2002
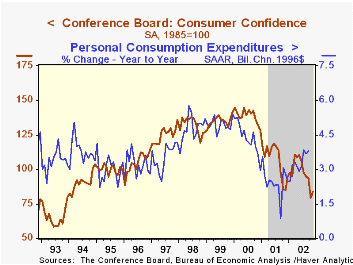
The Conference Board’s Index of Consumer Confidence this month recovered some of the October plunge. Consensus expectations were for a reading of 85.0. October's level was revised up slightly.
The 5.7% m/m gain in Consumer Confidence was the first m/m gain since May. It was in line with the rebound in the Consumer Sentiment reading from the University of Michigan.
The rise in confidence reflected higher readings of both the present situation and consumer expectations, but the gain in the present situation reading was just slight.
During the last ten years there has been a 48% correlation between the level of Consumer Confidence and the y/y percent change in real PCE.
The Conference Board's survey is conducted by a mailed questionnaire to 5,000 households and about 3,500 typically respond.
| Conference Board | Nov | Oct | Y/Y | 2001 | 2000 | 1999 |
|---|---|---|---|---|---|---|
| Consumer Confidence | 84.1 | 79.6 | -0.9% | 106.6 | 139.0 | 135.3 |
by Tom Moeller November 26, 2002
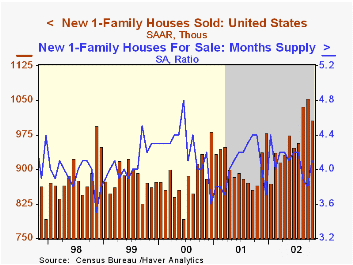
Sales of new single family homes remained near record territory last month. Sales fell 4.5% from September, but the strong sales in both August and September were revised higher. Consensus expectations were for a 980,000 sales rate.
Sales were mixed across the country’s regions. In the Northeast, sales fell 32.3% following the huge 88.2% gain a month earlier. Sales in the Midwest fell for the second consecutive month. In the West, sales rose for the third consecutive month and in the South sales recovered a piece of the September decline.
The median price of a new home rose 0.3% to $176,700 (3.2% y/y). Prices in September were revised down.
The new home sales data reflect current sales versus the existing home sales figure which reflect closings on past sales.
| Homes Sales (000s, AR) | Oct | Sept | Y/Y | 2001 | 2000 | 1999 |
|---|---|---|---|---|---|---|
| New Single-Family | 1,007 | 1,054 | 16.4% | 908 | 880 | 879 |

Tom Moeller
AuthorMore in Author Profile »Prior to joining Haver Analytics in 2000, Mr. Moeller worked as the Economist at Chancellor Capital Management from 1985 to 1999. There, he developed comprehensive economic forecasts and interpreted economic data for equity and fixed income portfolio managers. Also at Chancellor, Mr. Moeller worked as an equity analyst and was responsible for researching and rating companies in the economically sensitive automobile and housing industries for investment in Chancellor’s equity portfolio. Prior to joining Chancellor, Mr. Moeller was an Economist at Citibank from 1979 to 1984. He also analyzed pricing behavior in the metals industry for the Council on Wage and Price Stability in Washington, D.C. In 1999, Mr. Moeller received the award for most accurate forecast from the Forecasters' Club of New York. From 1990 to 1992 he was President of the New York Association for Business Economists. Mr. Moeller earned an M.B.A. in Finance from Fordham University, where he graduated in 1987. He holds a Bachelor of Arts in Economics from George Washington University.
More Economy in Brief


