Haver Analytics
Haver Analytics

Featured Data Additions: July 2026

  • EMERGEMAUganda → International Trade and Balance of Payments → Diaspora Remittance by Country

    Remittance statistics for Uganda were added to the EMERGEMA database. This data set includes inflows and outflows reported in USD in addition to the number of transactions for each. Totals plus detail for 240 countries and territories are included on this table. Monthly data are sourced from the Bank of Uganda and start in January 2025.

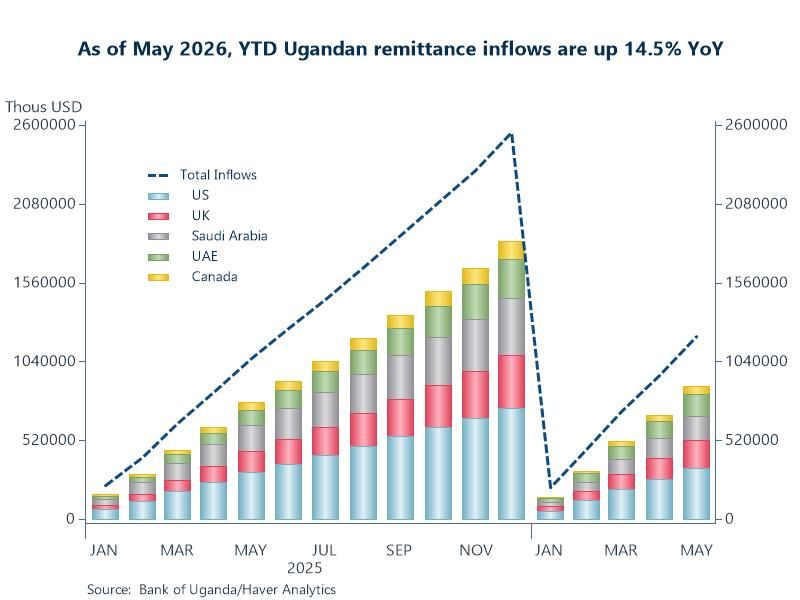
    Chart: Remittances are a critical pillar of the Ugandan economy, representing one of its largest sources of foreign exchange. These inflows act as a social protection system for millions of Ugandans, particularly the unemployed youth and the elderly. Inflows reached 2.6 billion USD in 2025, which is equivalent to approximately 3.8% of the country's GDP. Through May 2026, YTD remittances were up 14.5% YoY – where 70-75% consistently originates from the US, UK, Saudi Arabia, UAE and Canada.
  • EMERGELA → Eastern Caribbean Currency Union → Public Finance and Debt → Debt

    Public debt statistics for the ECCU and the eight individual member countries were added to EMERGELA. Tables include measures for total public sector debt, central government debt and public corporation debt with breakouts for domestic and external debt. Member countries include St. Lucia, Antigua and Barbuda, St. Vincent & the Grenadines, Grenada, St. Kitts & Nevis, Dominica, Anguilla and Montserrat. Quarterly data are sourced from the Eastern Caribbean Central Bank and start in Q1 2000.

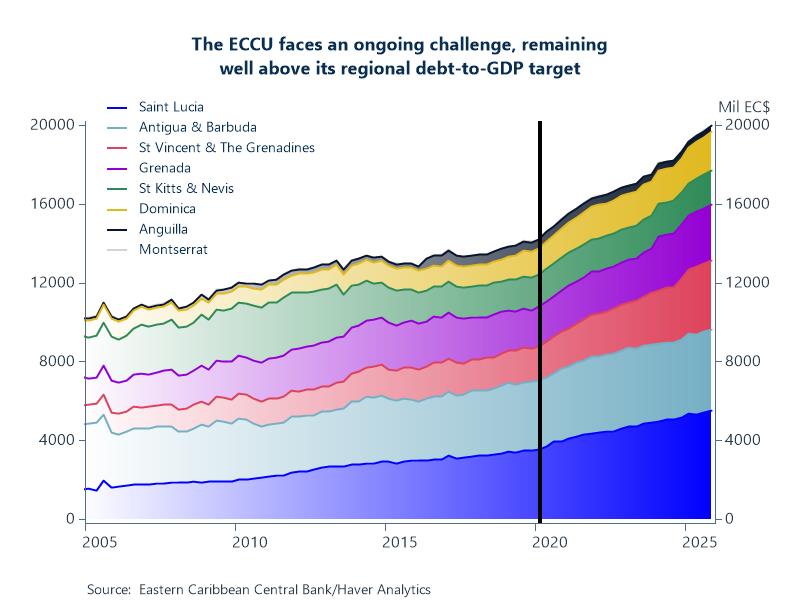
    Chart: The ECCU faces an ongoing challenge. With a current public debt-to-GDP ratio of 77.4%, it remains well above its regional target of 60% by 2035. Since Q1 2020, public sector debt in the region has grown by 5.8 billion EC$ - an increase of 41%. These small island countries have common underlying limitations – a heavy reliance on global tourism that has been severely impacted by the COVID pandemic, repeated natural disasters and exposure to the economic fallout of global crises.

  • EMERGEFMLiberia → International Trade and BOP → Trade by Country

    International trade statistics by country for Liberia were added to EMERGEFM. Imports and exports to and from Africa, Asia & the Middle East, Europe & Oceania, and the Americas & the Caribbean including 39 individual countries are available. Annual data reported in USD are sourced from the Central Bank of Liberia and start in 2010.

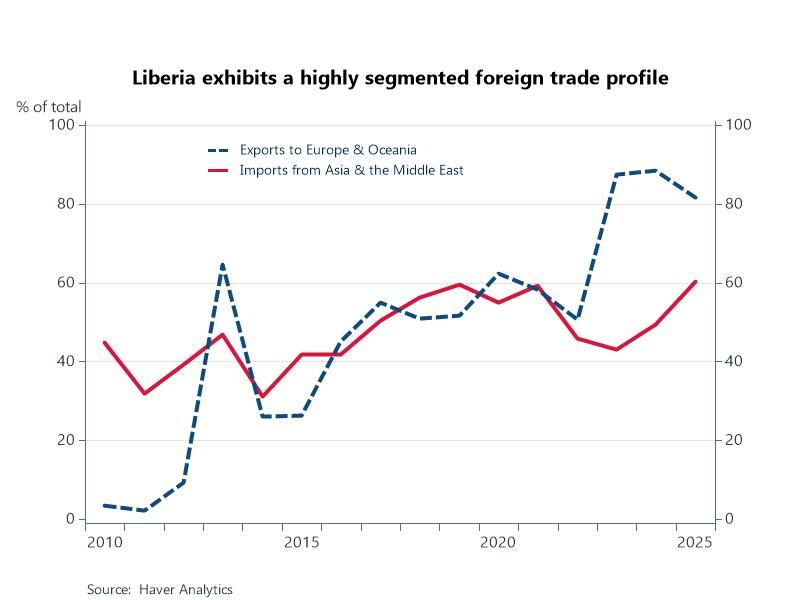
    Chart: Liberia exhibits a highly segmented foreign trade profile where Europe dominates export destinations, while Asia serves as the primary source for the country's imports. Europe is the destination for 82% of exports, of which 73% goes to Switzerland in the form of unwrought gold. 60% of Liberia's imports - led by machinery, petroleum, and manufactured goods - originate from Asia & the Middle East with China, India, and Turkey as the leading suppliers, accounting for 84% of imports from that region.

  • EMERGEFMLiberia → Production

    Production statistics for Liberia were added to the EMERGEFM database. Categories include agricultural products, manufactured goods, mineral products, and services. The table includes commodities important to Liberia’s economy such as gold, iron ore, diamonds, rubber, cocoa beans, and timber. Monthly data are sourced from the Central Bank of Liberia and start as early as January 2004.

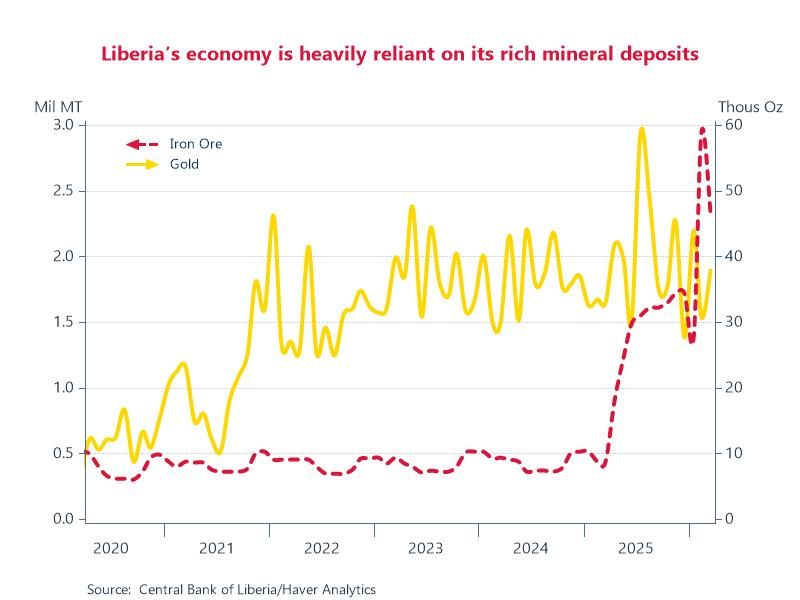
    Chart: Liberia’s economy is heavily reliant on the production and export of primary raw materials. The iron ore sector is the backbone and is experiencing a massive boom with production tripling from 5.2 million MT in 2024 to 14.9 million MT in 2025 – spiking in February 2026 recording 3 million MT in that month alone. Gold production increased 79% YoY in 2021 followed by 49% and 16% increases in the subsequent years – spiking in July 2025 with a record 59 thousand ounces extracted. Expansion in the mining sector is a core catalyst for projected real GDP growth of 5.5%.