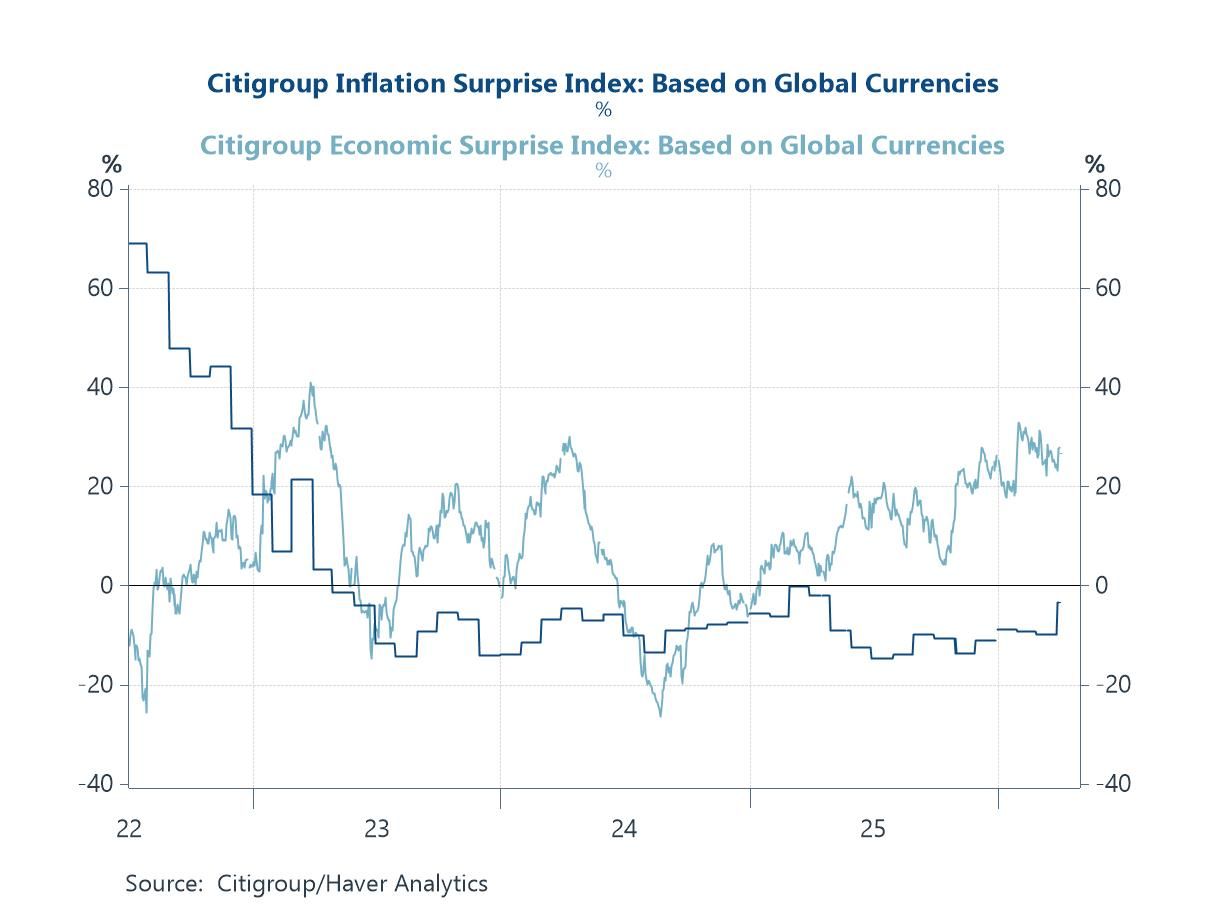
The signing of a Memorandum of Understanding (MoU) between the United States and Iran earlier this week has offered financial markets their most significant moment of geopolitical relief since the Middle East conflict escalated in early March. Oil prices fell sharply on the news, short-dated bond yields moved lower across several major economies, and risk assets recovered ground. But relief, as investors have learnt repeatedly over the past three months, is arguably not the same as resolution. The MoU sets a framework for negotiations rather than a final settlement, and the history of US-Iran diplomacy is not one that encourages complacency. Meanwhile, the Federal Reserve — concluding its June meeting yesterday under new chair Kevin Warsh — held rates steady but delivered a distinctly hawkish dot plot that shifted the median year-end projection from a cut to a hike, a reminder that the easing cycle the market had been pricing is no longer the base case. Against this backdrop, this week's charts take stock of where the global economy presently stands — and what the underlying data, beneath the geopolitical noise, are telling us. The picture that emerges is one of divergence. The United States continues to outperform consensus growth expectations while Europe and China disappoint (chart 1). UK short-dated yields have tracked oil prices with unusual consistency this year, and today's softer-than-expected CPI print for May — arriving just as the MoU has knocked crude lower — potentially changes the policy calculus for the Bank of England (chart 2). Global semiconductor sales, meanwhile, are storming ahead regardless of the geopolitical noise, powered by AI infrastructure spending that shows no sign of fatigue (chart 3). A cross-section of commodity prices tells two stories simultaneously: the geopolitical risk premium is draining out of oil, but the metals and materials the AI economy actually needs — copper, uranium, critical minerals — are holding firm (chart 4). Meanwhile a cross-country scatter of electricity generation and GDP growth over the past five years raises a question that deserves more attention than it typically gets: is energy availability a constraint on growth, or merely a consequence of it? The evidence, we would argue, points firmly in one direction (chart 5). And finally, for all the comparisons being drawn between the current investment boom and the late 1990s, the financial balance of the US corporate sector tells a rather different story — one that matters for how any correction might unfold (chart 6).
Introducing
Andrew Cates
in:Our Authors
Andy Cates joined Haver Analytics as a Senior Economist in 2020. Andy has more than 25 years of experience forecasting the global economic outlook and in assessing the implications for policy settings and financial markets. He has held various senior positions in London in a number of Investment Banks including as Head of Developed Markets Economics at Nomura and as Chief Eurozone Economist at RBS. These followed a spell of 21 years as Senior International Economist at UBS, 5 of which were spent in Singapore. Prior to his time in financial services Andy was a UK economist at HM Treasury in London holding positions in the domestic forecasting and macroeconomic modelling units. He has a BA in Economics from the University of York and an MSc in Economics and Econometrics from the University of Southampton.

Publications by Andrew Cates

 Global| Jun 18 2026
Charts of the Week: Between Relief and Reality
by:Andrew Cates
|in:Economy in Brief
- USA| Jun 15 2026
This Isn't 1999 — But That Doesn't Mean There's Nothing to Watch
The comparisons are hard to avoid. Soaring valuations, massive capital expenditure on data centres and AI infrastructure, and near-universal conviction that a transformative technology is about to reshape the economy. To many observers, today looks uncomfortably like the late 1990s.
The parallel is understandable. It is also, on the most important dimension, wrong — and Haver data help explain why.
The critical variable: who holds the debt
Investment booms become dangerous when they are financed by leverage. The late 1990s are a textbook case. As internet enthusiasm intensified, US corporations borrowed heavily to fund infrastructure buildout. By 2000, the non-financial corporate sector was running a financial deficit approaching 4% of GDP — spending substantially more than it earned. When expectations proved too optimistic, investment collapsed, and corporate deleveraging deepened the downturn.
by:Andrew Cates
|in:Viewpoints
 Global| Jun 11 2026
Charts of the Week: Inflation at the Crossroads
Global financial markets have been unsettled in recent days. Last week’s stronger-than-expected US employment report wrong-footed investors positioned for a more accommodative Federal Reserve, triggering a sharp reassessment of rate expectations and a notable sell-off in technology stocks — a sector that had been among the primary beneficiaries of the prevailing low-rate narrative. Persistent instability in the Middle East, in the meantime, has continued to keep energy markets on edge, with Brent crude remaining elevated and supply disruption risks showing little sign of abating. Against this backdrop, this week's charts draw on the latest Blue Chip Economic Indicators survey to assess where the global growth and inflation outlook now stands. The headline finding is sobering: GDP growth forecasts have been revised lower across most major economies over the past three months, with the energy shock doing real damage to the outlook in Europe— even as Taiwan's AI-driven semiconductor boom delivers the largest upward forecast revision of any economy in the survey (charts 1 and 2). Inflation expectations tell an equally uncomfortable story, with consensus forecasts for CPI in 2027 now sitting above most central banks' 2% target — a sign that the current shock may be leaving a more persistent scar than policymakers would like. Beneath the headline noise, however, recent US unit labour cost data offer a modestly reassuring signal (chart 3), even as renewed supply chain stress threatens the PPI pipeline (chart 4). We also revisit a structural energy argument made in previous editions of our Charts of the Week document (chart 5), before closing with China's trade data, where a normalisation in export flows to the United States has been quetly unfolding (chart 6).
by:Andrew Cates
|in:Economy in Brief
 Global| Jun 04 2026
Charts of the Week: Inflation Fears, AI Cheers
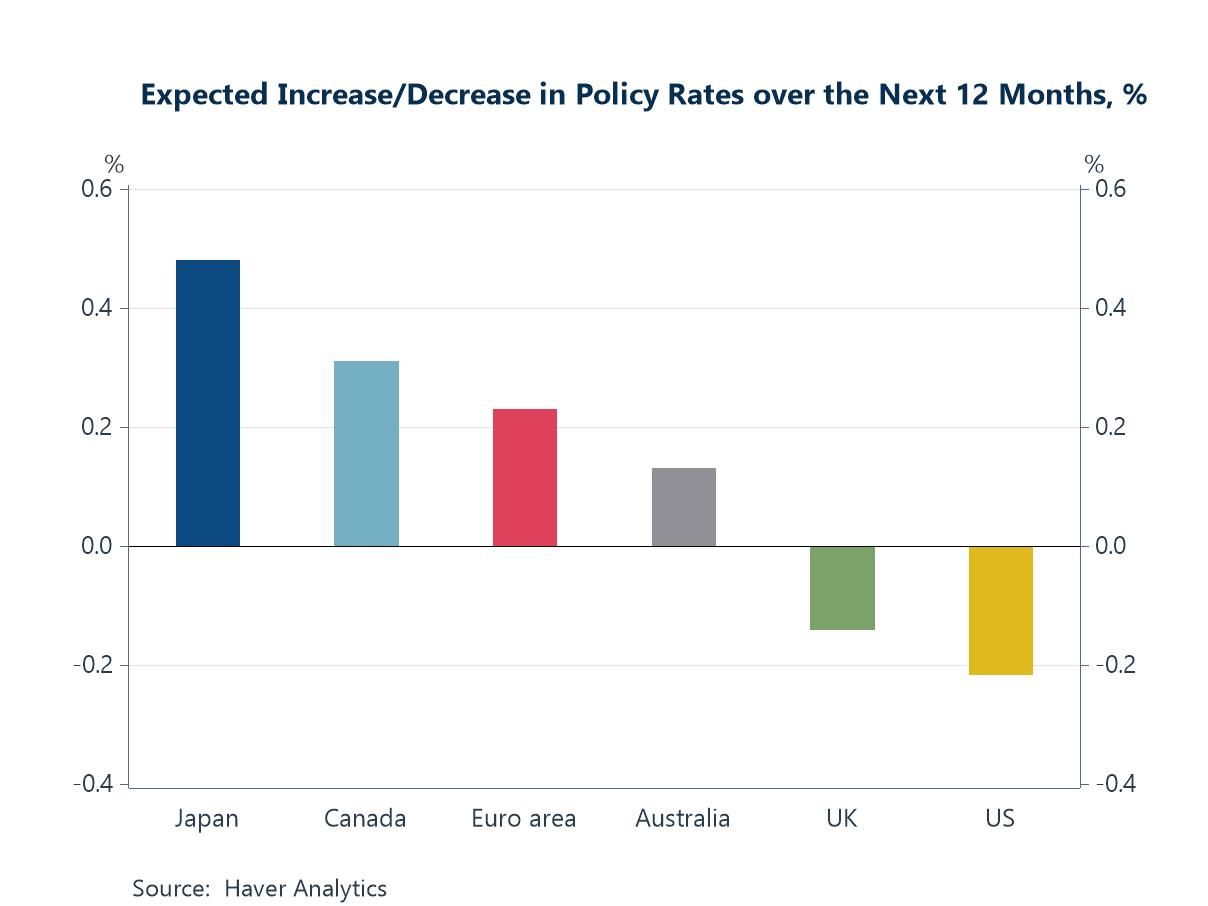
The global macro backdrop continues to evolve in ways that would have surprised many investors at the start of the year. Expectations of widespread monetary easing have steadily receded as inflation has proven more persistent and economic activity more resilient than anticipated. The latest Blue Chip Financial Forecasts point to a growing bias towards policy tightening rather than loosening in several major economies (chart 1), while rising US job opening rates suggest labour demand remains firmer than expected (chart 2). At the same time, ongoing instability in the Middle East continues to generate supply-side inflation risks and lengthier delivery times (chart 3). There are, however, also reasons for optimism. Manufacturing activity appears to be finding some support from a reduction in effective tariff rates facing many major US trading partners (chart 4). More importantly, the AI investment boom continues to gather momentum. South Korea's semiconductor exports surged by an extraordinary 169% year-on-year in May, highlighting the strength of global demand for AI-related hardware (chart 5). Unsurprisingly, investors continue to direct capital towards those markets most exposed to these trends, with Taiwan and South Korea attracting substantial equity inflows (chart 6). The bottom line is that inflation concerns and higher-for-longer interest rates remain important risks, but they are increasingly being offset, for now, by a combination of improving economic conditions and one of the strongest technology-driven investment cycles in modern history.
by:Andrew Cates
|in:Economy in Brief
 Global| May 28 2026
Charts of the Week: The AI Boom Meets Inflation Angst
The global macro backdrop remains dominated by instability in the Middle East and the lingering inflation concerns associated with elevated energy prices. Yet recent days have at least offered some tentative relief. Oil prices have softened amid heightened hopes that negotiations between the US and Iran could eventually ease tensions and help stabilise energy markets, even if the broader geopolitical situation remains fragile and key shipping routes continue to face disruption. Against this backdrop, the latest survey data continue to highlight an uneven global economy, with Europe looking particularly vulnerable given its greater sensitivity to higher energy costs and its weaker links to the global AI investment boom (chart 1). At the same time, rising gasoline prices continue to weigh heavily on US household confidence (the Michigan measure), raising concerns about the resilience of consumer demand (chart 2). An important question confronting markets in the meantime is whether inflation fears are now becoming overstated. Unlike during the post-pandemic inflation shock, central bank balance sheets are now shrinking rather than expanding aggressively, while money supply growth remains relatively weak across many major economies (charts 3 and 4). Meanwhile, the extraordinary boom in AI-related infrastructure spending — spanning data centres, utilities, water systems and semiconductors — continues to provide a major offset to broader macroeconomic weakness and remains a key pillar supporting global equity markets despite elevated geopolitical and inflation concerns (charts 5 and 6).
by:Andrew Cates
|in:Economy in Brief
 Global| May 21 2026
Charts of the Week: Surprise, Surprise
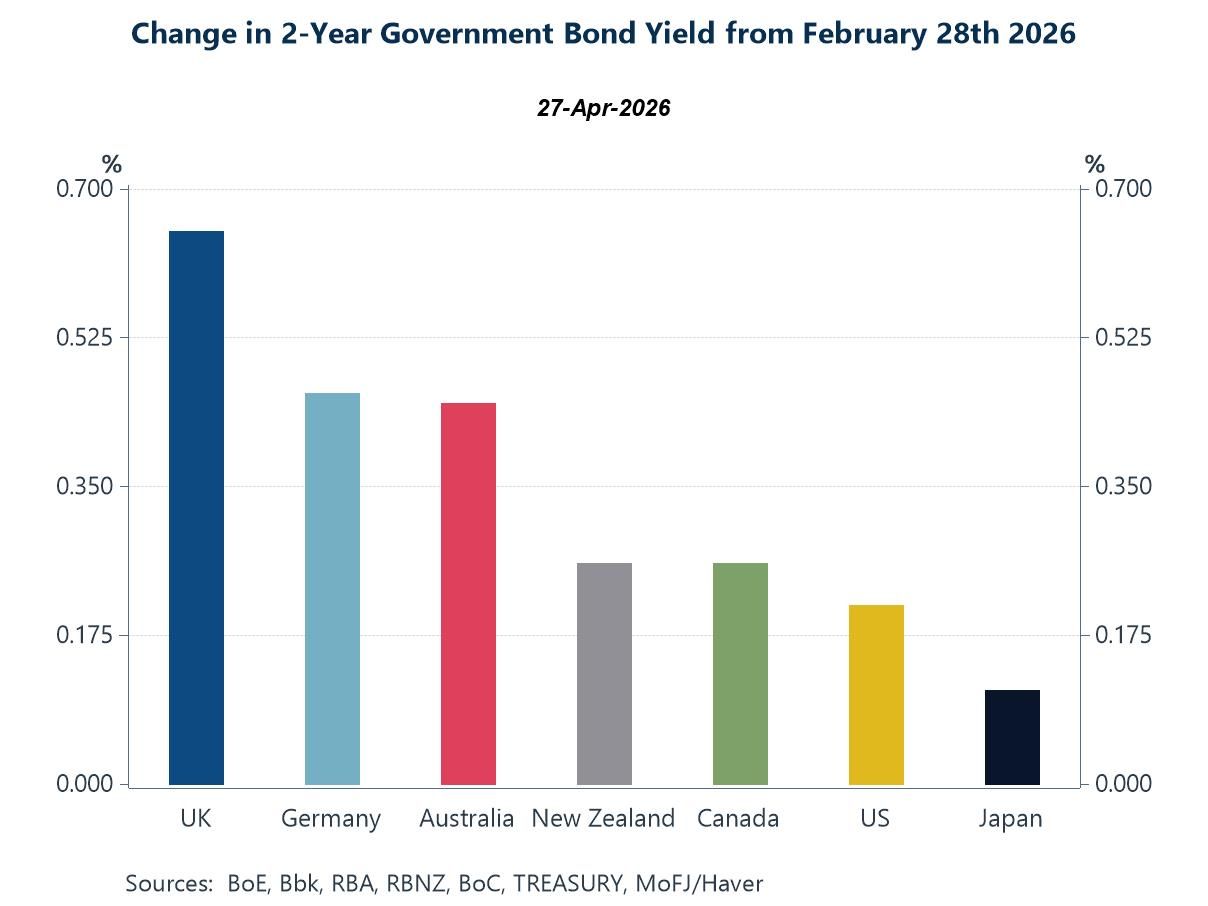
Ongoing geopolitical tensions in the Middle East and the associated surge in energy prices have pushed inflation and bond market concerns back to the forefront of global financial markets. Investors are increasingly worried that central banks may now face even greater difficulty in bringing inflation fully under control, particularly in economies where underlying price pressures had already remained sticky prior to the latest energy shock. Recent upside surprises in US labour market and inflation data have already contributed to higher Treasury yields and a broader global backup in short-term government bond yields across the major economies (charts 1 and 2). Yet the picture is not entirely one-sided. Labour’s share of US national income remains historically weak, suggesting limited underlying wage bargaining power and helping explain why broader inflation persistence could ultimately remain contained (chart 3). Meanwhile, oil prices have remained elevated despite some moderation in broader geopolitical risk indicators, reflecting persistent supply-side disruption and ongoing stress surrounding key global energy and shipping routes (chart 4). Even so, recent core inflation data from economies including the UK, Canada and Austria suggest that pass-through from higher energy costs into broader underlying inflation has so far remained relatively limited (chart 5). At the same time, financial markets continue to be supported by an extraordinary AI-driven investment boom, with technology firms engaged in an unprecedented surge in spending on data centres, semiconductors and energy infrastructure (chart 6). Increasingly, the global economy appears caught between two powerful and competing forces: renewed supply-side inflation risks on one side and a historic wave of AI-driven technological investment on the other.
by:Andrew Cates
|in:Economy in Brief
 Global| May 14 2026
Charts of the Week: The Tug of War
The global economy is still caught between two powerful and competing forces. On one side, the AI investment boom continues to support growth, industrial activity and equity markets, particularly in the US and parts of Asia. On the other, renewed Middle East tensions and higher energy prices are adding to inflation risks and broader policy uncertainty. The latest Blue Chip survey reflects this divide clearly: growth expectations have generally held up best in economies tied to AI-related investment and technology supply chains, while inflation forecasts have risen more sharply in more energy-exposed economies such as the UK and euro area (chart 1). Forecasters still largely expect only limited pass-through from higher energy prices into core inflation, although recent US CPI data suggest underlying price pressures remain somewhat sticky (charts 2 and 3). At the same time, the extraordinary continued surge in global AI investment — now approaching $300 billion annually — highlights the sheer scale of capital being deployed into semiconductors, data centres and digital infrastructure, particularly in the United States (chart 4). The divergence in industrial production trends also reinforces the growing gap between economies benefiting from structural growth drivers — such as Taiwan’s semiconductor sector and Denmark’s pharmaceutical industry — and those struggling with higher energy costs and weaker competitiveness, notably Germany and the UK (chart 5). Meanwhile, improving Chinese activity indicators suggest policy support and stronger technology demand may finally be helping to stabilise growth (chart 6). Overall, the world economy remains resilient, but increasingly uneven, with AI-related investment continuing to offset — though not eliminate — the drag from geopolitical fragmentation and rising energy insecurity.
by:Andrew Cates
|in:Economy in Brief
 Global| May 07 2026
Charts of the Week: Still Standing
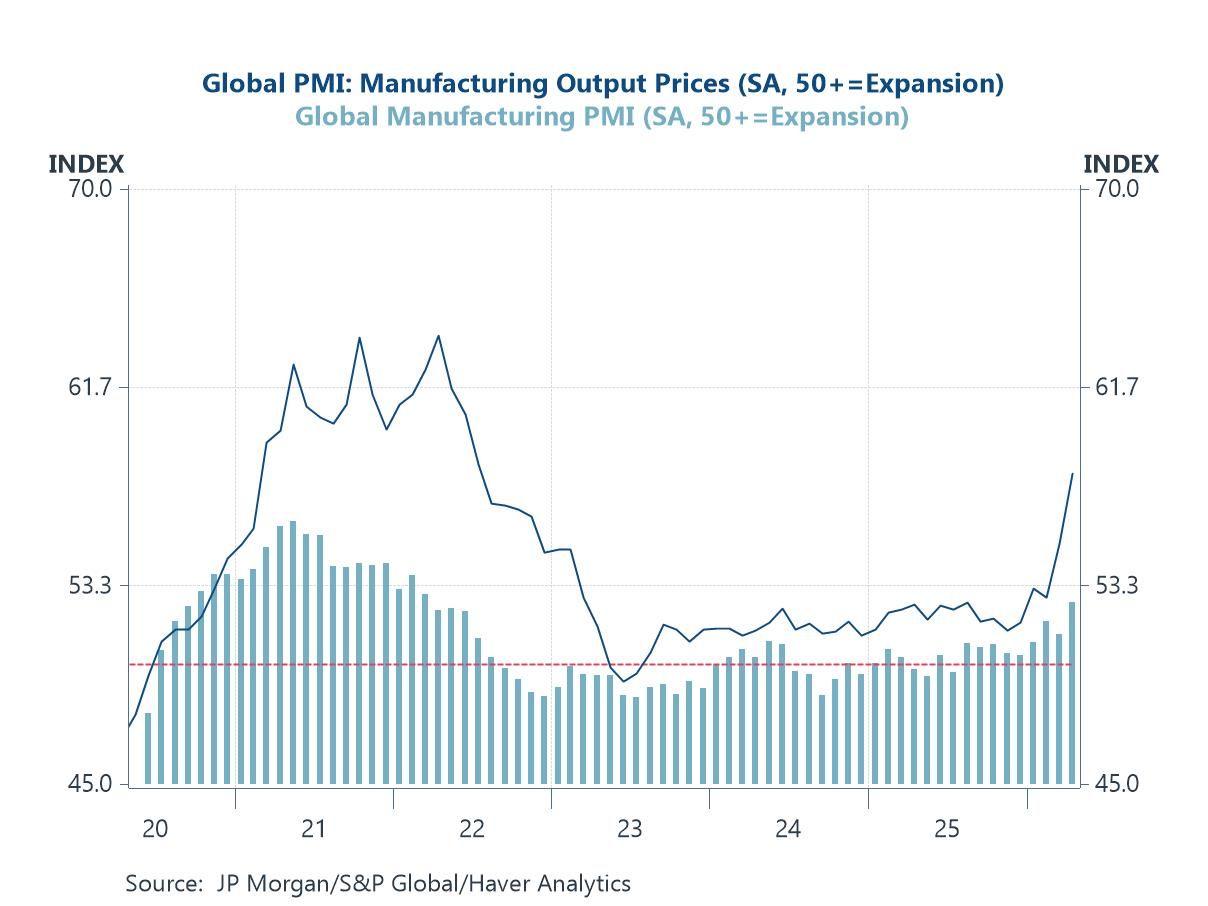
Recent developments point to the possibility of a peace settlement in the Middle East, which has offered some tentative relief to energy markets. Financial markets have responded with cautious optimism, but the outlook remains highly uncertain, with much depending on whether any agreement proves durable and supply disruptions are fully unwound. Against this backdrop, our charts this week highlight a global economy that is holding up better than expected but facing renewed cost pressures. Manufacturing activity remains resilient, supported by AI investment, reduced tariff disruption and defence spending, even as output prices firm (chart 1). Supply-side frictions are also still evident: shipping costs have risen, broader supply chain pressures are rebuilding (chart 2), and crude oil production has been curtailed by export and storage constraints among key regional producers (chart 3). These dynamics have reinforced inflation risks and shifted policy expectations in a more hawkish direction (chart 4). Meanwhile, US credit conditions appear broadly neutral, suggesting neither strong deleveraging nor releveraging pressures (chart 5). Finally, wage growth remains central to the outlook, particularly in the UK, where pressures are still comparatively elevated (chart 6). Taken together, the message is one of resilience under strain: growth is holding up, but the balance between inflation and activity is becoming increasingly delicate, leaving policymakers—and markets—navigating a narrow and uncertain path ahead.
by:Andrew Cates
|in:Economy in Brief
 Global| Apr 30 2026
Charts of the Week: Tension Beneath the Surface
Against a backdrop of persistent geopolitical tensions, firmer energy prices and a busy week of central bank meetings—including the Fed, ECB, BoE and BoJ—financial markets have remained notably resilient, even as the macro narrative has softened at the margin. The message from this week’s charts is one of growing tension beneath that surface calm. Front-end bond yields have moved higher, signalling a shift toward a more cautious, “higher-for-longer” policy outlook (chart 1). At the same time, real-time recession indicators for the United States suggest risks remain contained for now (chart 2). Consumer confidence data paint a more uneven picture, with sharper declines in the euro area and UK than in the US, highlighting regional vulnerabilities to the current energy shock (chart 3). The ECB’s latest bank lending survey reinforces this, pointing to tighter credit conditions and weaker demand—factors that are likely to weigh further on European growth (chart 4). By contrast, developments in the semiconductor sector underline a different dynamic: an intensifying global boom, with accelerating price pressures reflecting both strong AI-driven demand and emerging supply-side constraints linked indirectly to energy and logistics disruptions (chart 5). Finally, labour market data confirm that the AI surge is not merely a market narrative but a tangible structural shift, with hiring for AI-related roles accelerating across economies (chart 6). Taken together, these signals point to a more complex macro environment—one in which resilient markets coexist with softening growth, more persistent inflation risks and increasingly delicate policy trade-offs.
by:Andrew Cates
|in:Economy in Brief
 Global| Apr 23 2026
Charts of the Week: Risks Build, Markets Shrug
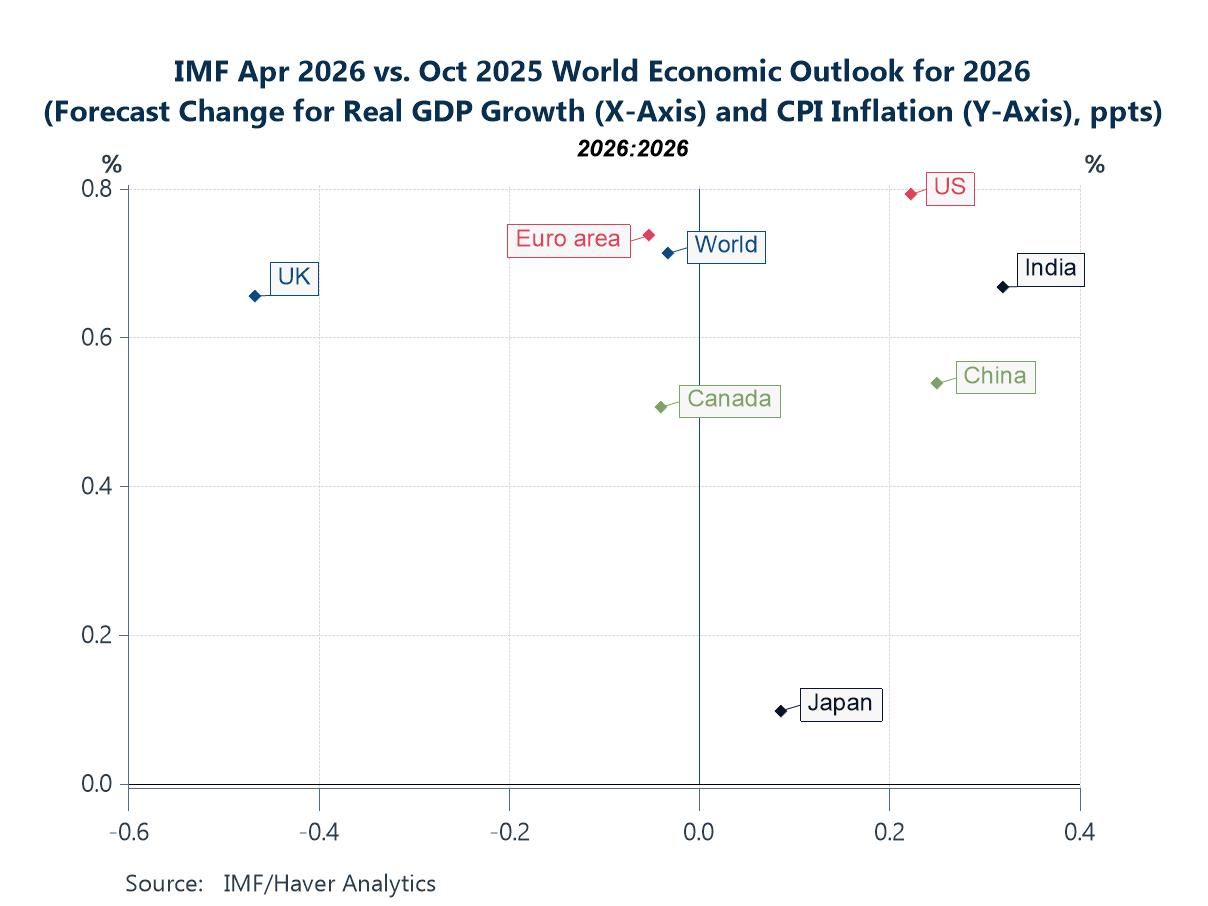
Financial markets have remained notably calm in recent weeks despite rising geopolitical tensions in the Middle East, a more downbeat macroeconomic narrative and elevated uncertainty. Measures of financial stress and volatility remain low, and equity markets continue to look through both the conflict and softer data. That resilience sits alongside a more nuanced macro backdrop. The IMF’s latest WEO revisions point to a classic stagflationary energy shock—growth downgraded and inflation revised higher—although the global impact remains modest and uneven, with some economies still benefiting from stronger momentum (chart 1). At the same time, market pricing appears increasingly detached from the data flow, with volatility declining even as growth surprises have turned more negative relative to inflation (charts 2 and 3). Incoming inflation data reinforce the idea of a largely headline-driven shock, with nowcasts rising in line with higher energy prices but only limited pass-through into core inflation so far (charts 4 and 5). However, it remains early days. Survey evidence, such as the latest ZEW release, suggests that inflation expectations may already be responding in a more concerning way, with a marked rise alongside weakening growth sentiment (chart 6). Taken together, the key question for markets is whether this remains a contained, energy-driven shock that can be looked through—or whether it begins to embed more persistently via expectations, forcing a reassessment of the currently benign outlook.
by:Andrew Cates
|in:Economy in Brief
 Global| Apr 09 2026
Charts of the Week: From Oil Shock to Policy Dilemma
Amid further tentative signs of de-escalation—most notably President Trump’s decision on April 7th to step back from further escalation—financial markets have stabilised somewhat, but the macroeconomic implications of the Middle East crisis remain highly uncertain. As our charts show, the global economy entered this shock from a position of relative strength, with positive growth surprises and easing inflation pressures still evident in the data (chart 1). However, that benign backdrop now looks vulnerable. Central banks are already reassessing the outlook, with expectations for policy easing being pared back (chart 2) and a growing consensus that any response to persistent energy-driven inflation will likely involve delaying cuts rather than tightening aggressively—albeit with significant regional divergence (chart 3). Financial markets, for their part, are not yet signalling a loss of inflation control, but the rise in real yields suggests increasing concern around the broader policy mix, particularly fiscal pressures (chart 4). Finally, the adjustment to the shock is unlikely to be uniform. Structural differences in domestic energy capacity are already driving wide divergences in electricity prices, leaving more import-dependent economies exposed to higher costs and sharper trade-offs between growth and inflation (charts 5 and 6). Taken together, the message is clear: even if geopolitical tensions ease, the economic aftershocks are likely to be uneven, persistent and increasingly shaped by structural constraints.
by:Andrew Cates
|in:Economy in Brief
 Global| Apr 01 2026
Charts of the Week: Strait Stress
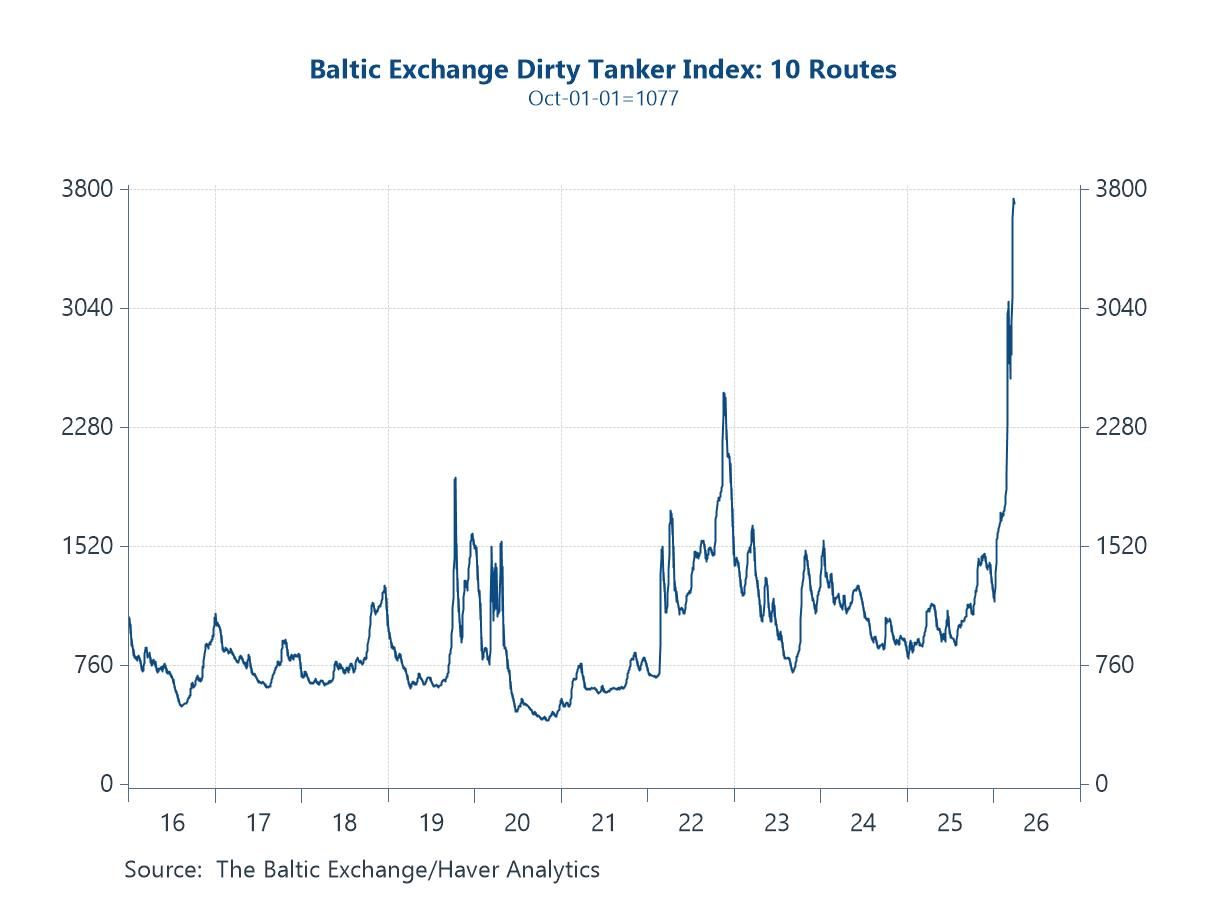
Amid tentative signs of de-escalation from the US administration over the past 48 hours—including suggestions that the conflict with Iran could conclude relatively quickly—financial markets have begun to retrace some of last week’s sharp repricing of Middle East risk. Oil prices have come off their highs, while equities and bonds have rallied as risk premia ease. That said, the earlier phase of the week saw a decisive adjustment: oil surged, front-end yields moved higher, and uncertainty rose as investors grappled with the implications of disrupted energy flows. Even now, the overall adjustment has been uneven—volatility has picked up, but not to levels typically associated with sustained geopolitical stress—raising questions about how fully markets are internalising both the risks and the rapidly shifting outlook. Our charts this week capture these cross-currents. Tanker rates have spiked as shipping routes are disrupted and capacity tightens (chart 1), while PMI delivery times point to early signs of supply chain strain feeding into the real economy (chart 2). At the same time, the divergence between elevated policy uncertainty and relatively contained market volatility suggests there could have been a degree of complacency (chart 3). The rise in oil prices is already feeding into higher short-term yields, though this is being tempered by cooling labour markets, anchored inflation expectations and more cautious central bank signalling (charts 4 and 5). Meanwhile, euro area flash CPI has picked up, but core inflation remains relatively benign, suggesting underlying price pressures are still contained for now (chart 6).
by:Andrew Cates
|in:Economy in Brief
- of22Go to 1 page