 Global| Jun 05 2025
Charts of the Week: Fault Lines and Rate Cuts
by:Andrew Cates
|in:Economy in Brief
Summary
Recent weeks have seen a complex recalibration in global financial markets, as investors weigh the implications of renewed US tariff actions against accumulating signs of economic softness and growing confidence in the prospect of central bank easing. As part of this recalibration, there has been heightened, if not uniformly sustained, concern about the safe-haven appeal of US assets, with long-dated Treasury yields rising at times on fiscal worries and the US dollar showing episodic vulnerability. Yet despite these concerns, consensus forecasts continue to anticipate meaningful policy rate cuts across most major economies (chart 1). Shorter-dated yields in bond markets have moved in sympathy, with 2-year Treasury yields, for example, have trending lower from mid-May, tracking a deterioration, albeit modest, in the US labour market (chart 2). Lower oil prices and a slew of negative inflation surprises have further softened inflation expectations (chart 3). In the euro area, wage growth and services inflation have also cooled, giving the ECB more latitude to reduce its policy rates again this week (chart 4). The growth backdrop, in the meantime, remains fragile, with global export demand and new manufacturing orders softening, and increasingly exposed to a drag from protectionist US trade policy (chart 5). Finally, China’s entrenched financial imbalances — persistent private sector surpluses, fiscal deficits, and external imbalances — remain a key source of domestic fragility and global distortion (chart 6).
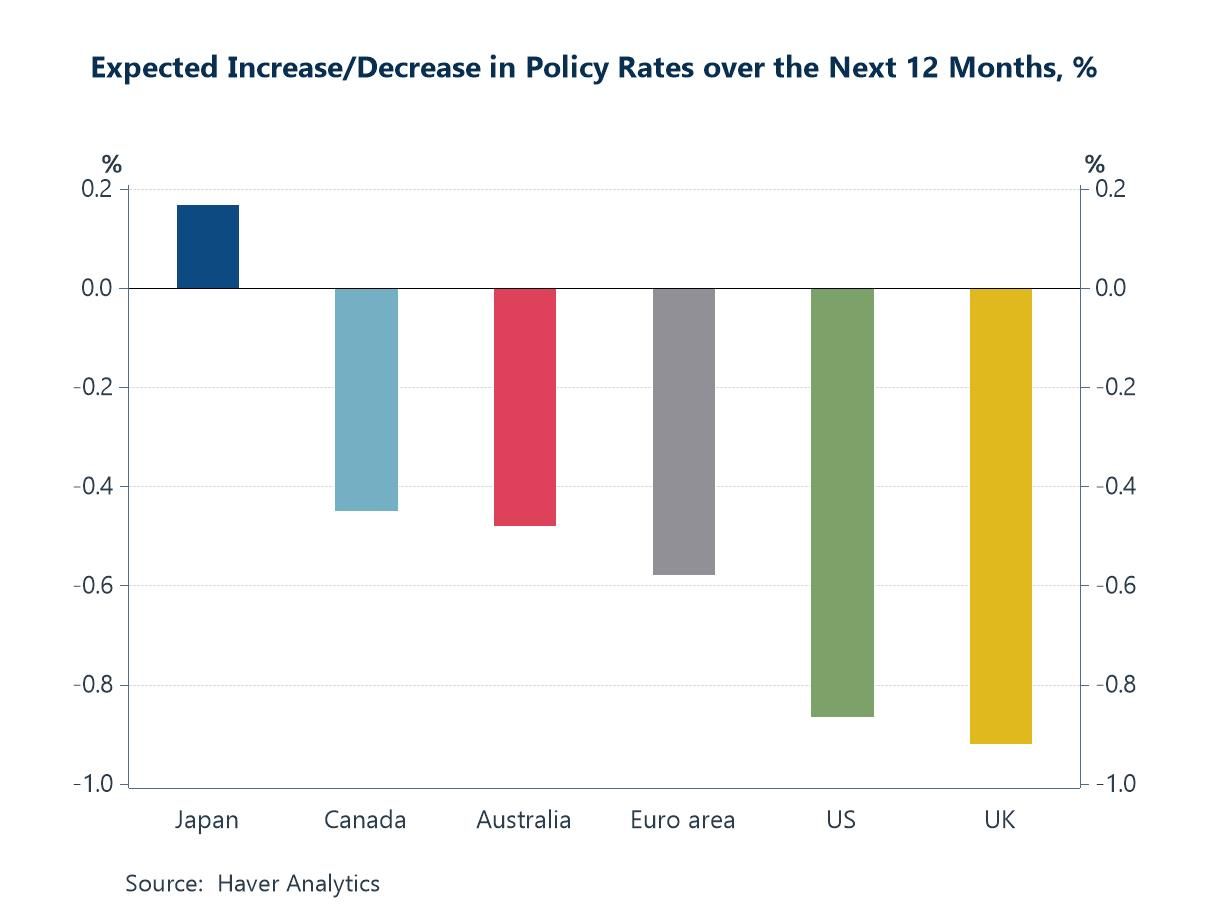
The global policy rate consensus Despite concerns about inflation, consensus forecasts from the Blue Chip Financial Forecasts survey still reflect expectations for meaningful interest rate cuts across most major economies over the next 12 months. The chart below shows that forecasters anticipate policy rates to fall by between 50 and 90 basis points in countries such as the US, UK, euro area, Canada, and Australia. In contrast, Japan is the lone outlier, with forecasts pointing to a further modest rate increase — highlighting its position in a different part of the global monetary cycle. Overall, this consensus arguably suggests that the inflationary effects of protectionism are, for now, being outweighed by expectations of weaker demand.
Chart 1: Blue Chip Financial Forecasts: Expectations for policy rates in 12 months
The Fed and the US labour market This chart reinforces the case for the Federal Reserve to further ease policy, with both market signals and underlying economic conditions pointing to a more accommodative stance. Downward shifts in 2 year Treasury yields have closely tracked movements in the ISM manufacturing employment Index, which has – on the whole - remained consistent the 50-point threshold that signals employment expansion. The alignment of softer labour market data with falling short-term yields signals confidence that the Fed will probably prioritize demand-side weakness and labour market softness over tariff-driven inflation pressures.
Chart 2: US 2-year yields versus US ISM Employment Index

Oil and inflation This next chart underscores the increasingly disinflationary role of energy, with the year-on-year change in WTI crude oil prices now firmly in negative territory. After being a major driver of headline inflation during 2021 and early 2022, oil prices are now exerting downward pressure on global inflation rates. This shift has coincided with a sharp decline in the Citigroup G10 Inflation Surprise Index, which has also lately shifted into negative territory after a short period of upside surprises. Alongside the charts above, the message is clear — declining energy prices are acting as a powerful disinflationary force, helping to stabilise expectations and clear space for further loosening of monetary policy.
Chart 3: Global oil price versus Citigroup G10 inflation surprise index

Euro area inflation and wage pressures This fourth chart underscores the growing case for further policy easing by the European Central Bank, with wage growth and services inflation — core drivers of domestic price pressures — now decelerating sharply. This synchronized decline signals that second-round inflation effects in the euro area are rapidly fading. For the ECB more specifically, this trend provides cover to pivot toward another round of rate cuts later this week.
Chart 4: Euro area service sector CPI inflation versus the ECB’s Wage Tracker

Global trade This next chart underscores the fragile state of global trade — and the mounting downside risks posed by escalating US tariff policies. The Global PMI for Manufacturing New Export Orders remained well below the 50 threshold in May, signalling ongoing contraction in global trade flows. At the same time, South Korea’s export growth, a bellwether for global industrial demand and tech-cycle sensitivity, has continued to weaken. Both indicators reflect a world economy grappling with weak external demand, geopolitical uncertainty, and a retreat from globalization. With the US now aiming to implement broad-based tariffs on a range of imports (notwithstanding recent legal challenges), the risk is that already-fragile export orders deteriorate further.
Chart 5: South Korea’s export growth versus the export orders index from the Global PMI

China’s imbalances This final chart highlights the deep structural imbalances in China’s economy and its ongoing role in global financial disequilibrium. The private sector has consistently run large savings surpluses — recently nearly 10% of GDP — reflecting chronic under-consumption and excess saving. Meanwhile, the general government sector remains in persistent deficit, around 8% of GDP, driven by state-led investment and fiscal support. The foreign sector remains in surplus, underscoring China’s continued reliance on net exports and its limited appetite for foreign capital outflows. These dynamics reveal a domestic model still overly dependent on state intervention and weak household demand. Globally, China’s excess savings and export surpluses exacerbate trade and capital imbalances, pressuring deficit economies like the US and distorting global interest rates. Without rebalancing toward consumption and reduced reliance on external demand, China will remain both a source and amplifier of global financial tension.
Chart 6: China’s financial balances


Andrew Cates
AuthorMore in Author Profile »Andy Cates joined Haver Analytics as a Senior Economist in 2020. Andy has more than 25 years of experience forecasting the global economic outlook and in assessing the implications for policy settings and financial markets. He has held various senior positions in London in a number of Investment Banks including as Head of Developed Markets Economics at Nomura and as Chief Eurozone Economist at RBS. These followed a spell of 21 years as Senior International Economist at UBS, 5 of which were spent in Singapore. Prior to his time in financial services Andy was a UK economist at HM Treasury in London holding positions in the domestic forecasting and macroeconomic modelling units. He has a BA in Economics from the University of York and an MSc in Economics and Econometrics from the University of Southampton.
More Economy in Brief


