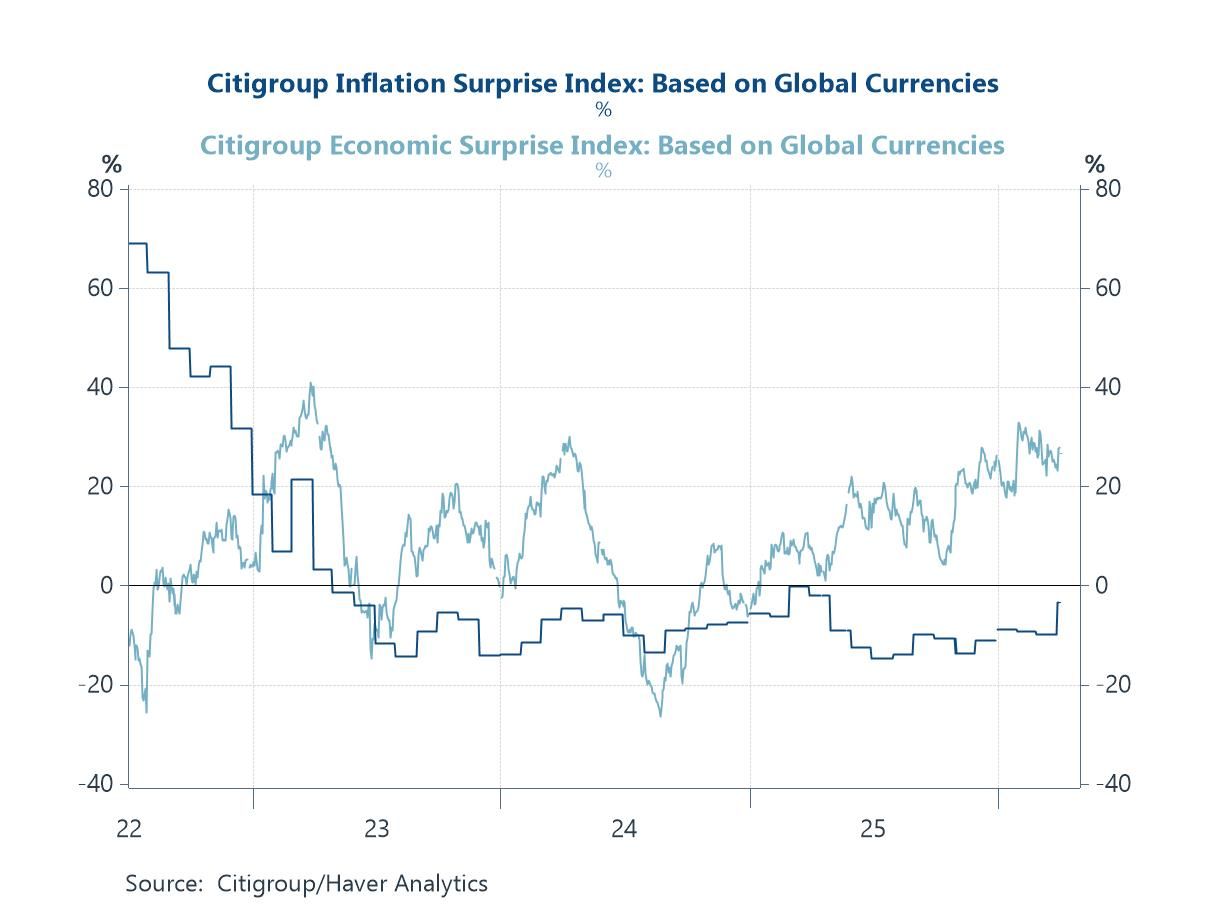
Amid further tentative signs of de-escalation—most notably President Trump’s decision on April 7th to step back from further escalation—financial markets have stabilised somewhat, but the macroeconomic implications of the Middle East crisis remain highly uncertain. As our charts show, the global economy entered this shock from a position of relative strength, with positive growth surprises and easing inflation pressures still evident in the data (chart 1). However, that benign backdrop now looks vulnerable. Central banks are already reassessing the outlook, with expectations for policy easing being pared back (chart 2) and a growing consensus that any response to persistent energy-driven inflation will likely involve delaying cuts rather than tightening aggressively—albeit with significant regional divergence (chart 3). Financial markets, for their part, are not yet signalling a loss of inflation control, but the rise in real yields suggests increasing concern around the broader policy mix, particularly fiscal pressures (chart 4). Finally, the adjustment to the shock is unlikely to be uniform. Structural differences in domestic energy capacity are already driving wide divergences in electricity prices, leaving more import-dependent economies exposed to higher costs and sharper trade-offs between growth and inflation (charts 5 and 6). Taken together, the message is clear: even if geopolitical tensions ease, the economic aftershocks are likely to be uneven, persistent and increasingly shaped by structural constraints.
Introducing
Andrew Cates
in:Our Authors
Andy Cates joined Haver Analytics as a Senior Economist in 2020. Andy has more than 25 years of experience forecasting the global economic outlook and in assessing the implications for policy settings and financial markets. He has held various senior positions in London in a number of Investment Banks including as Head of Developed Markets Economics at Nomura and as Chief Eurozone Economist at RBS. These followed a spell of 21 years as Senior International Economist at UBS, 5 of which were spent in Singapore. Prior to his time in financial services Andy was a UK economist at HM Treasury in London holding positions in the domestic forecasting and macroeconomic modelling units. He has a BA in Economics from the University of York and an MSc in Economics and Econometrics from the University of Southampton.

Publications by Andrew Cates
 Global| Apr 09 2026
Charts of the Week: From Oil Shock to Policy Dilemma
by:Andrew Cates
|in:Economy in Brief
 Global| Apr 01 2026
Charts of the Week: Strait Stress
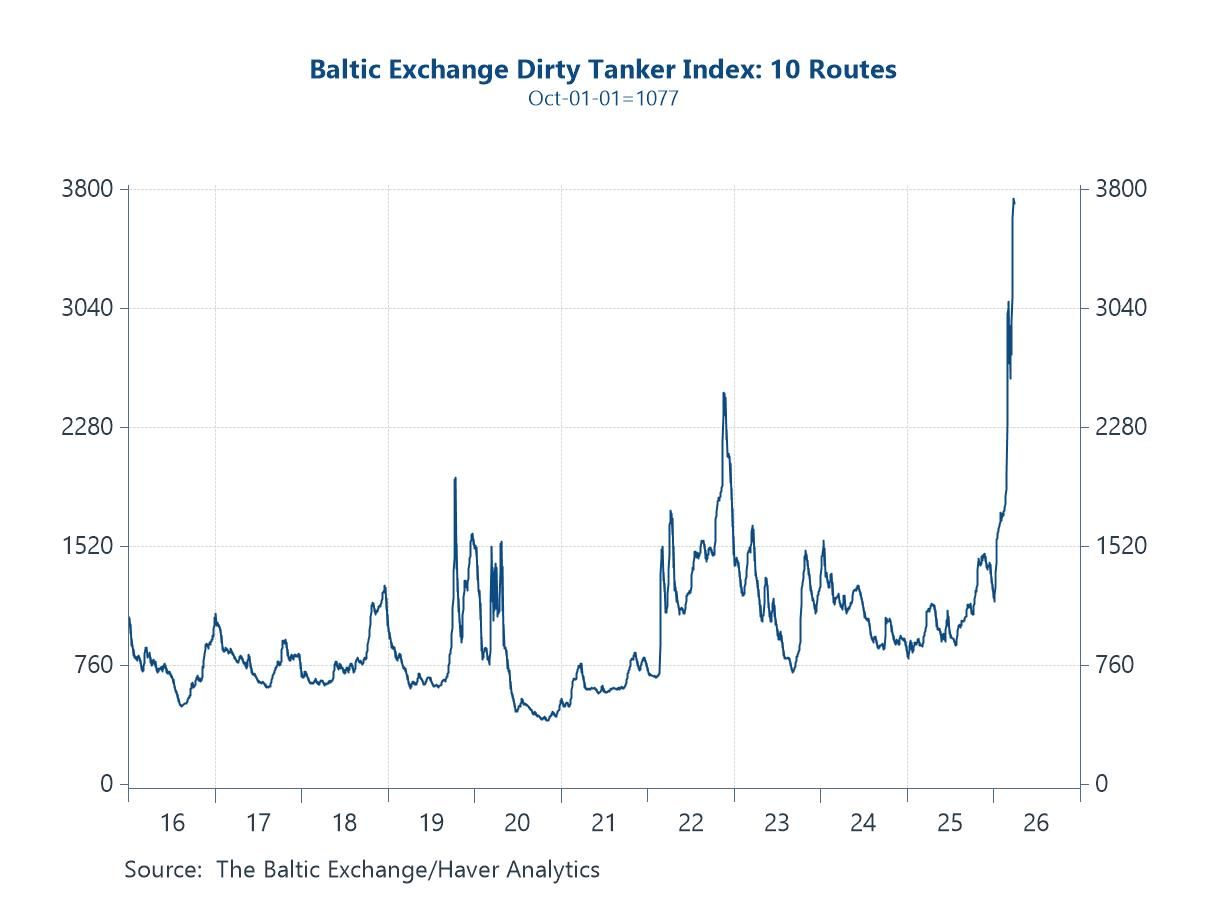
Amid tentative signs of de-escalation from the US administration over the past 48 hours—including suggestions that the conflict with Iran could conclude relatively quickly—financial markets have begun to retrace some of last week’s sharp repricing of Middle East risk. Oil prices have come off their highs, while equities and bonds have rallied as risk premia ease. That said, the earlier phase of the week saw a decisive adjustment: oil surged, front-end yields moved higher, and uncertainty rose as investors grappled with the implications of disrupted energy flows. Even now, the overall adjustment has been uneven—volatility has picked up, but not to levels typically associated with sustained geopolitical stress—raising questions about how fully markets are internalising both the risks and the rapidly shifting outlook. Our charts this week capture these cross-currents. Tanker rates have spiked as shipping routes are disrupted and capacity tightens (chart 1), while PMI delivery times point to early signs of supply chain strain feeding into the real economy (chart 2). At the same time, the divergence between elevated policy uncertainty and relatively contained market volatility suggests there could have been a degree of complacency (chart 3). The rise in oil prices is already feeding into higher short-term yields, though this is being tempered by cooling labour markets, anchored inflation expectations and more cautious central bank signalling (charts 4 and 5). Meanwhile, euro area flash CPI has picked up, but core inflation remains relatively benign, suggesting underlying price pressures are still contained for now (chart 6).
by:Andrew Cates
|in:Economy in Brief
 Global| Mar 26 2026
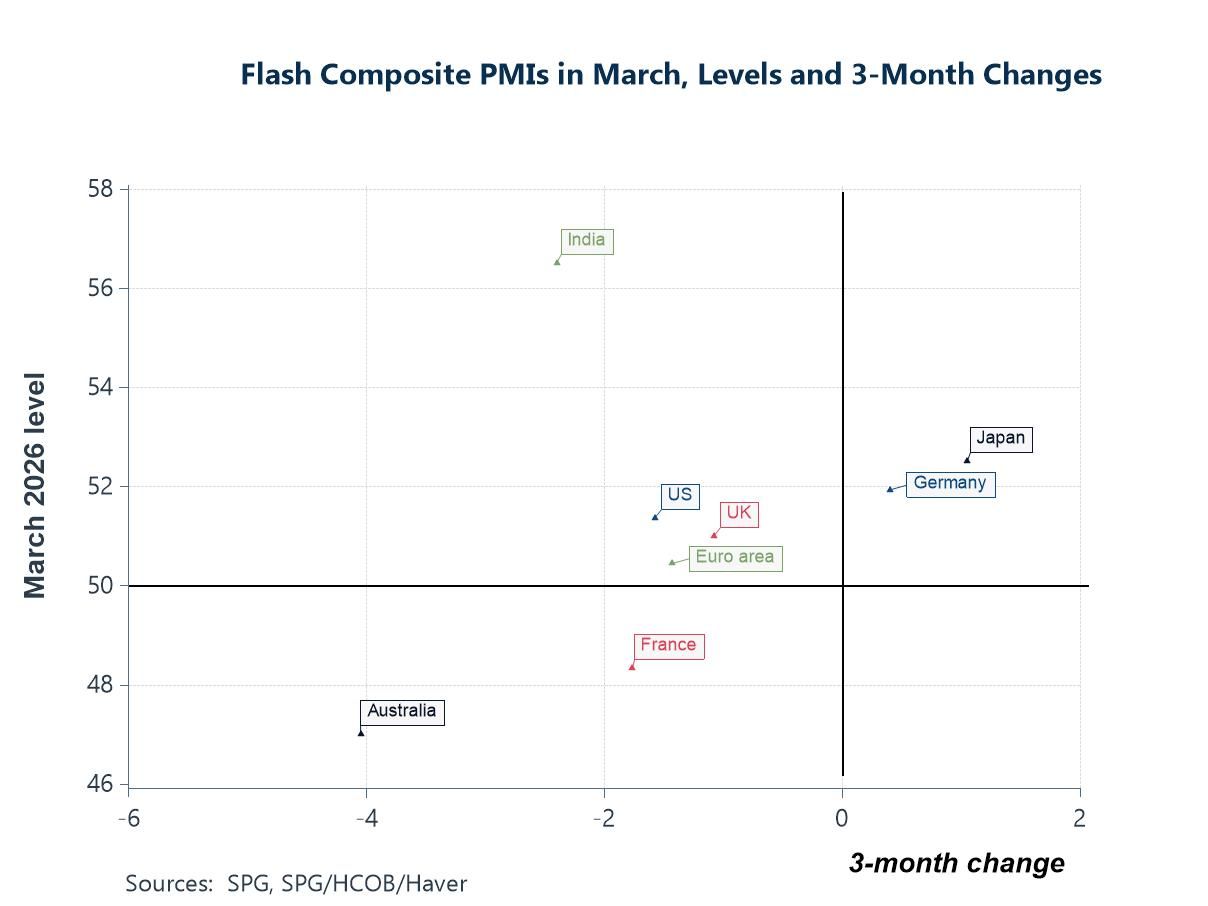
Charts of the Week: A Supply-Constrained World Comes into Sharper Focus
Recent de-escalation signals in the Middle East have offered some relief to markets, but the economic aftershocks from the earlier escalation are still feeding through—particularly via energy prices and heightened geopolitical risk. Crucially, these shocks are not hitting a clean cyclical backdrop. Instead, they are amplifying a set of pre-existing supply-side pressures—fragmented trade, strained supply chains, and a more complex policy environment—that have been building for some time. The charts this week pick up that theme. Forward-looking sentiment indicators suggest global growth has lost some momentum, even if activity remains in expansion territory (chart 1). At the same time, broader measures of uncertainty remain elevated (chart 2), while supply chain stress is once again moving higher, reinforcing the idea that disruption is becoming more structural (chart 3). Financial markets are reflecting this shift, with increased uncertainty around the future path of policy rates (chart 4), and survey evidence pointing to a more fundamental challenge around the credibility and transmission of monetary policy itself (chart 5). And yet, there are some offsets. Despite the recent spike in oil prices, medium-term inflation expectations—at least in the US—remain relatively well anchored (chart 6). Even so, the overall message is one of a more fragile, supply-driven cycle—where shocks like the Middle East do not just disrupt the outlook, but intensify the underlying constraints shaping the global economy.
by:Andrew Cates
|in:Economy in Brief
- Global| Mar 24 2026
Shock, Supply and Constraint
The Middle East crisis and the limits of the global economy
For three decades, macroeconomics has leaned on a simple idea: that demand management can stabilise the system. In reality, that framework has been fraying for years. The latest escalation in the Middle East doesn’t just reinforce the point—it sharpens it. This is not another cyclical shock, but a reminder that the global economy is increasingly governed by supply-side constraints that policy cannot easily offset.
Even with tentative signs of de-escalation emerging this week, the episode has brought into much sharper focus a theme I have been returning to repeatedly: the global economy is no longer primarily demand-constrained. It is increasingly shaped—and at times paralysed—by supply-side limits.
by:Andrew Cates
|in:Viewpoints
 Global| Mar 19 2026
Charts of the Week: Energy Shock — Early Signals, Uncertain Fallout
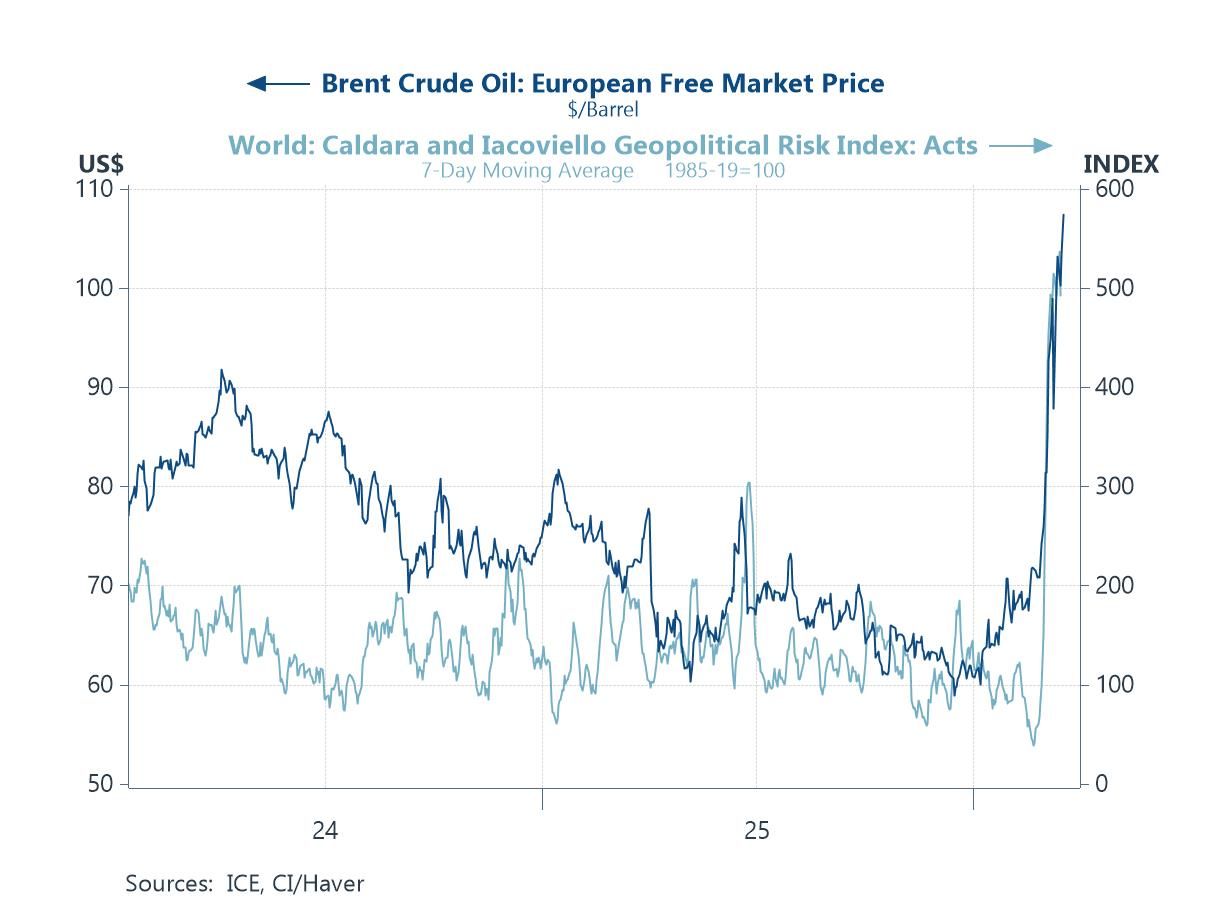
The past few weeks have seen a sharp escalation in tensions in the Middle East, triggering a rapid repricing across energy markets and a rise in geopolitical risk (chart 1). This comes at a time when the global economy is still heavily dependent on fossil fuels, leaving it structurally exposed to such shocks (chart 2), while longer-run increases in energy use per capita—driven in large part by industrialisation in China and elsewhere—have contributed to a rise in real energy prices over time (chart 3). Financial markets have been responding, with short-dated bond yields edging higher as expectations of monetary easing are reassessed (chart 4), and forward-looking sentiment indicators are showing early signs of softening (chart 5). At the same time, and of note, there are some tentative signs of stabilisation in parts of the global economy, notably in China where investment has picked up at the margin, supported by policy-led infrastructure spending (chart 6). Even so, it remains early days, and the balance of risks continues to tilt toward a more fragile outlook should the instability in the Middle East persist.
by:Andrew Cates
|in:Economy in Brief
 Global| Mar 11 2026
Charts of the Week: Geopolitics Meets the Global Economy
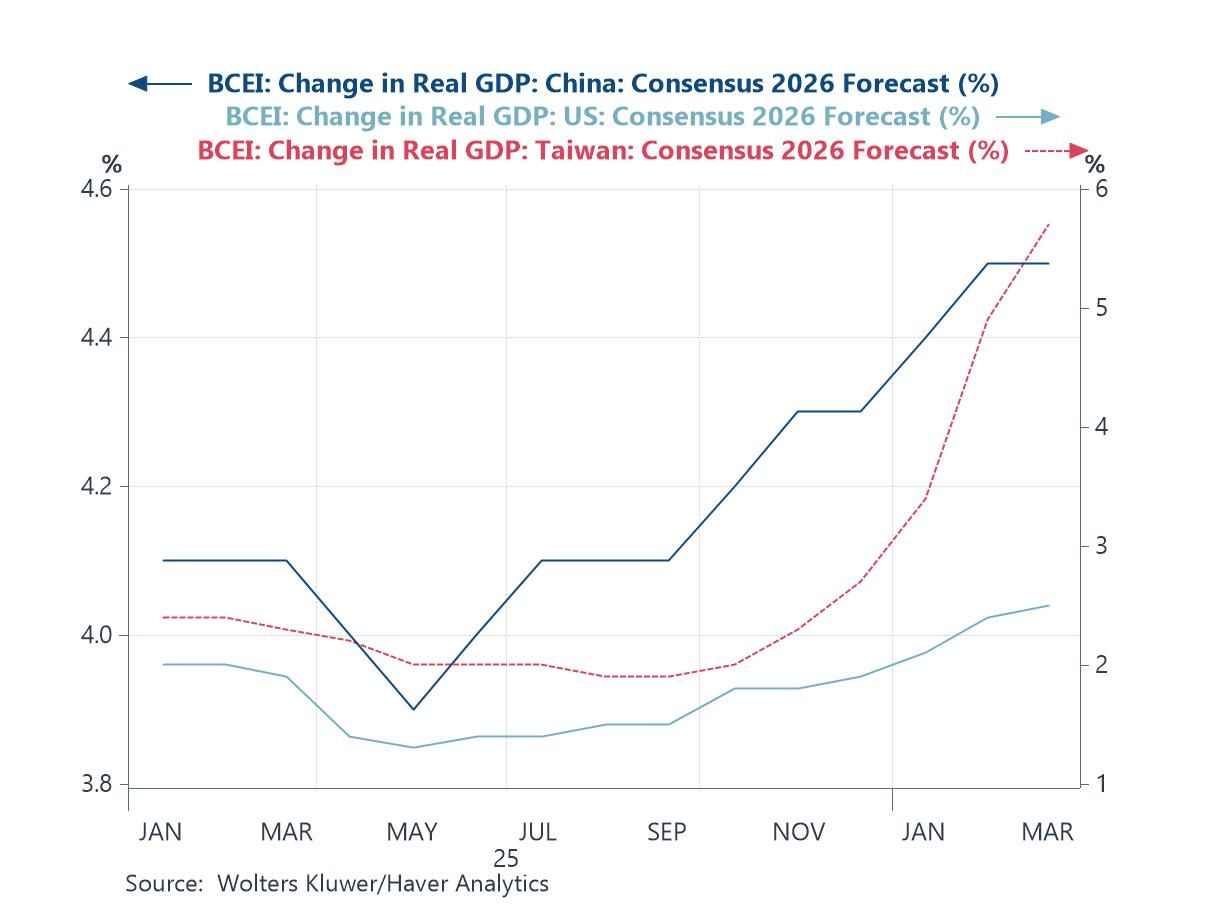
The past few days have seen financial markets rattled by a sharp escalation of tensions in the Middle East, with oil prices rising, risk assets wobbling and investors reassessing the potential macroeconomic fallout from a possible energy shock. Yet, taken together, this week’s charts suggest that the global economic outlook has so far remained relatively resilient. Blue Chip consensus forecasts for 2026 growth have held steady in recent months, with Taiwan’s steadily improving outlook hinting at the ongoing influence of the global AI investment cycle. That said, forward-looking sentiment indicators are beginning to show some cracks: the latest Sentix expectations index registered a sharp deterioration in March, potentially reflecting rising geopolitical uncertainty. Inflation expectations, by contrast, have shifted only modestly, with forecasters making few meaningful revisions despite the recent surge in oil prices. Financial markets appear to share that view, as movements in two-year US Treasury yields—often a proxy for expectations of Federal Reserve policy—have not mirrored the sharp rise in crude prices, suggesting investors currently see the oil shock as temporary. The final charts highlight why energy markets nonetheless remain central to the outlook: many major economies remain significant net oil importers, and in much of Asia oil price movements feed quickly into consumer energy inflation. Should geopolitical tensions persist and keep crude prices elevated, these channels could yet transmit broader macroeconomic pressures in the months ahead.
by:Andrew Cates
|in:Economy in Brief
 Global| Mar 04 2026
Charts of the Week: Shockwaves from the Gulf
Geopolitical tensions in the Middle East have escalated sharply following joint air strikes by Israel and the United States on strategic targets in Iran. While the ultimate trajectory of the conflict remains highly uncertain, the episode highlights the potential for geopolitical shocks to ripple through multiple channels of the global economy—from energy markets and shipping routes to supply chains, inflation dynamics and monetary policy. In this week’s Charts of the Week, we present six charts that illustrate some of the key issues, implications and points to watch, including movements in geopolitical risk (chart 1), shipping activity through the Strait of Hormuz (chart 2), energy prices (chart 3), global supply chain pressures (chart 4), inflation surprises (chart 5) and the evolving structure of global electricity generation (chart 6). Together they provide a framework for thinking about how events in the region could shape the outlook for the world economy in the months ahead.
by:Andrew Cates
|in:Economy in Brief
 Global| Feb 26 2026
Charts of the Week: The AI Undercurrent
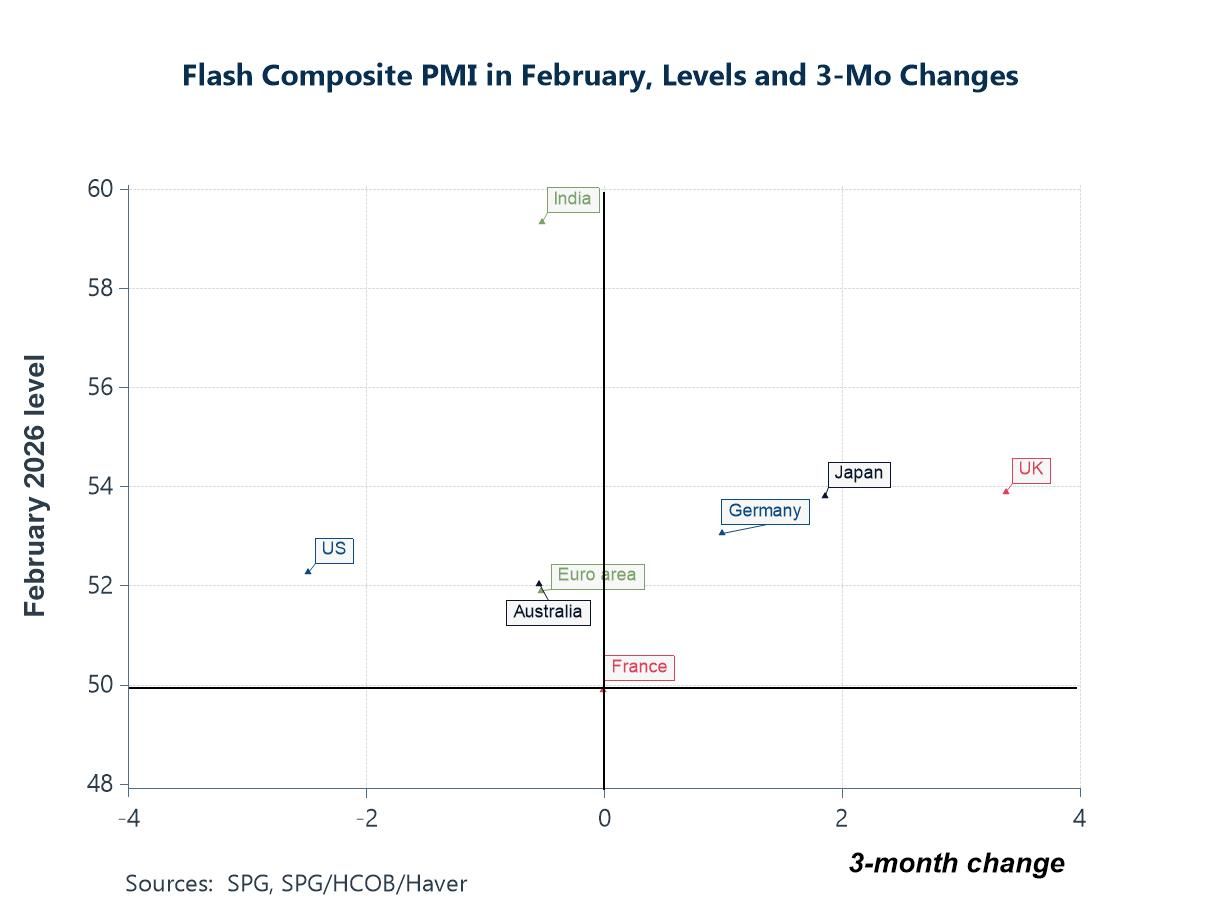
Over the past few days, financial markets have been navigating a fresh wave of policy and geopolitical cross-currents, with the US Supreme Court ruling on executive tariff authority adding a new layer of uncertainty to the trade outlook. At the same time, the AI investment boom continues to provide an important cyclical tailwind, even as investors remain alert to valuation risks, while renewed tensions involving Iran have reintroduced an energy risk premium. Against that backdrop, this week’s charts paint a picture of a global economy that is still expanding but becoming more differentiated. Latest flash PMI surveys confirm that global activity remains in growth territory despite some cooling in the US (chart 1). Strong semiconductor exports from Korea (chart 2) and surging US data-centre investment (chart 3) both underscore the continued force of the AI capex cycle, while a strong pickup in German capital goods orders (chart 4) hints at a more traditional, policy-linked investment impulse emerging in Europe. Meanwhile, the tight co-movement between oil prices and US front-end yields highlights (chart 5) the ongoing macro sensitivity to energy markets, and the recent downward drift in Japanese government bond yields — alongside softer data surprises — suggests that global bond markets may be receiving at least a modest anchoring impulse from Japan (chart 6).
by:Andrew Cates
|in:Economy in Brief
 Global| Feb 19 2026
Charts of the Week: AI, Policy Easing and a Shifting Risk Premium
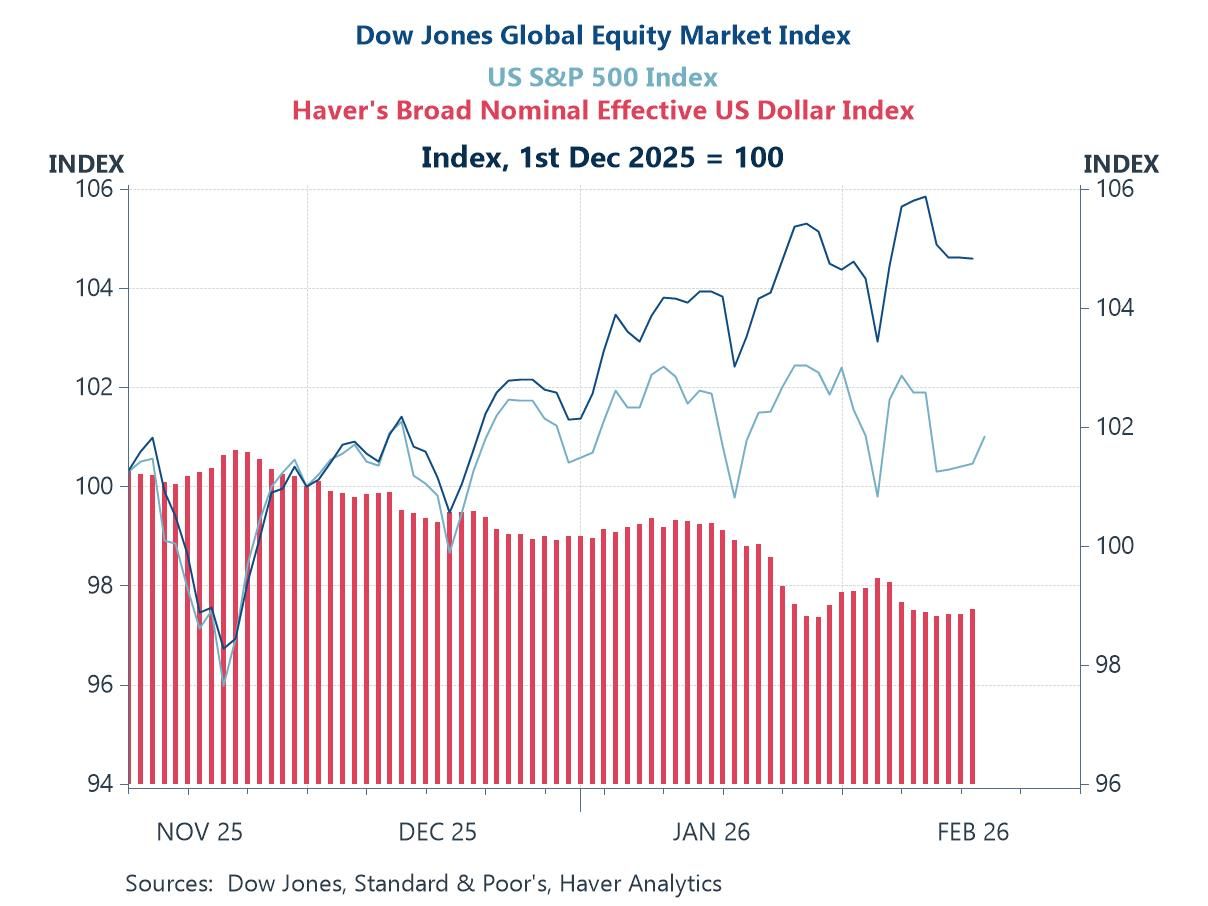
Recent weeks have seen renewed market swings — a softer US dollar, rotation within equities and shifting rate expectations — as investors reassess valuations, policy risks and the durability of US exceptionalism. Yet a consistent macro thread runs through our charts this week. Global equities continued to outperform the US, hinting at a modest rise in the US risk premium alongside AI-valuation concerns (chart 1). At the same time, firmer bank lending growth across major economies reflects looser monetary policy and arguably helps explain why risk assets remain broadly supported despite volatility (chart 2). On productivity, a US pickup is evident but likely reflects capital deepening from AI infrastructure rather than a decisive surge in total factor productivity (chart 3). Industrial production in advanced Asia reinforces where that build-out is concentrated — at the heart of the semiconductor supply chain (chart 4) — while strong US orders for computers and electronic products underline the intensity of domestic demand for high-tech and AI-related equipment (chart 5). Finally, renewed equity inflows into Emerging Asia show investors positioning around this AI-centric growth dynamic (chart 6). In short, easier policy and AI-driven investment are sustaining momentum — but the breadth and durability of the productivity dividend remain a key open question.
by:Andrew Cates
|in:Economy in Brief
 Global| Feb 12 2026
Charts of the Week: AI-Led Growth Meets Monetary Divergence
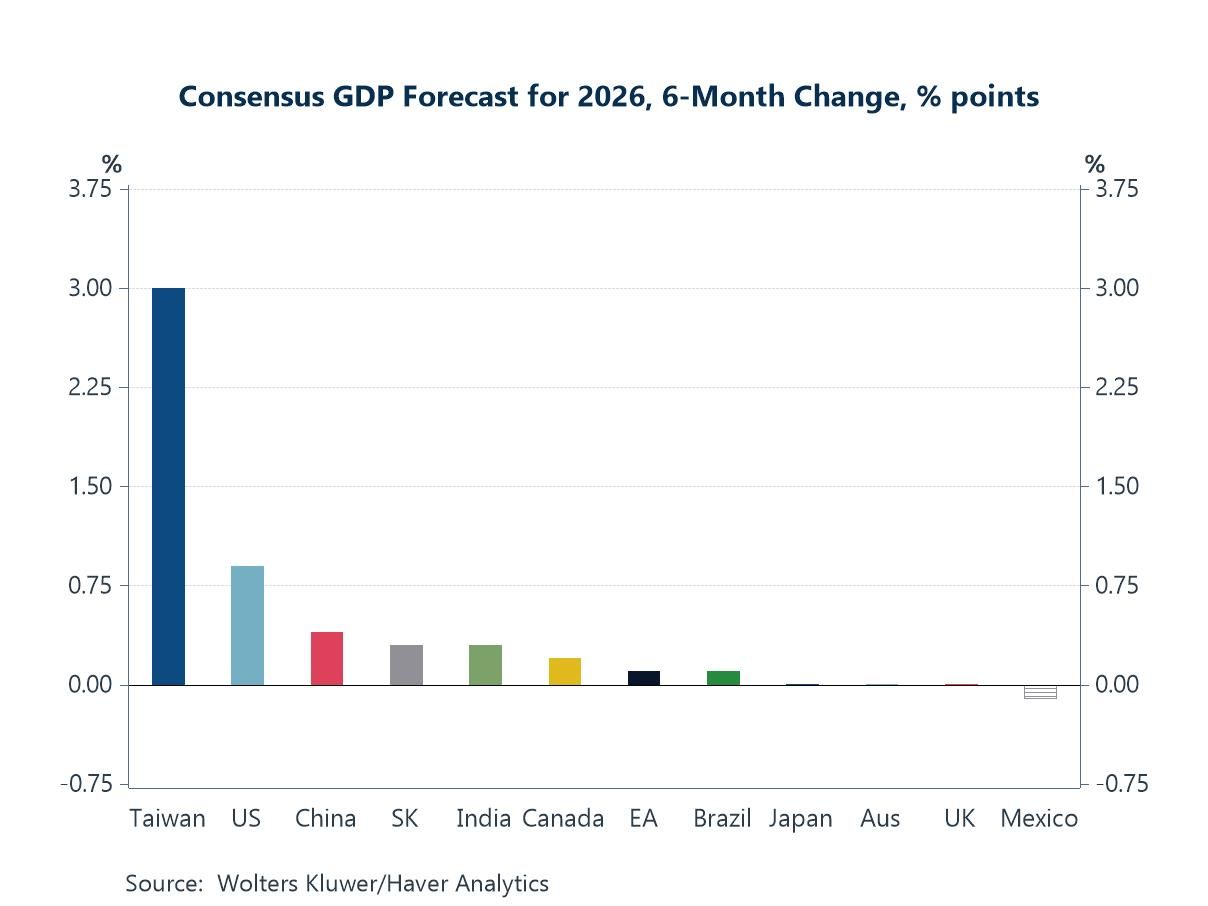
While markets have been unsettled at times by shifting policy expectations, geopolitical noise and questions around valuation, underlying global macroeconomic signals remain broadly supportive. Upgrades to Blue Chip consensus growth forecasts for parts of Asia — led by Taiwan — point to the tangible impact of the AI-driven tech cycle, a theme reinforced by the sharp rebound in semiconductor exports from South Korea (charts 1 and 3). At the same time, revisions to inflation forecasts underline a growing divergence in monetary policy paths, with easing still expected in the US and UK, while tighter stances persist elsewhere (chart 2). Importantly, there is little evidence so far that global supply-chain pressures are re-emerging in a way that would reignite inflation, notwithstanding lingering trade policy tensions (chart 4). Against this backdrop, rising policy uncertainty — particularly in the US — stands out as a potential source of risk, with implications for asset pricing and risk premia (chart 5). Yet the improvement in global sentiment surveys and a continued run of positive economic surprises suggest that markets are responding not just to policy noise, but to a genuinely resilient and improving macroeconomic environment (chart 6).
by:Andrew Cates
|in:Economy in Brief
 Global| Feb 05 2026
Charts of the Week: Balanced Policy, Resilient Data and AI Narratives
Financial markets have experienced renewed gyrations in recent weeks, as shifting geopolitical risks, questions around Federal Reserve independence, renewed talk of US dollar “debasement,” and ongoing enthusiasm surrounding artificial intelligence have combined to drive volatility across asset classes. These cross-currents have also contributed to a degree of rotation away from high-flying technology stocks, as investors reassess valuations and the timing of anticipated AI-driven gains. Against this backdrop, the charts in this week’s COTW highlight several important themes. Policy rate expectations now appear more balanced globally, marking a clear shift away from the one-sided easing bias of the past two years (chart 1), even as resilient US data—underscored by the unexpected jump in the January ISM index and a run of positive economic surprises—continues to complicate the outlook for monetary easing (chart 2). At the same time, US financial conditions remain relatively benign, with limited evidence of widespread credit stress or aggressive tightening in lending standards (chart 3). Meanwhile, the sharp rebound in semiconductor sales and the accelerating rollout of large-scale AI models underscore why investors remain so focused on the AI narrative, even as Europe lags behind due to weaker industrial momentum and a smaller footprint in advanced chip production (charts 4 and 5). Finally, while some scepticism about AI’s ultimate economic impact persists, the latest survey results suggest a moderation in concerns that markets are materially overestimating its gains (chart 6). Taken together, these developments paint a picture of a US economy that remains more resilient than many had anticipated, set against a financial landscape increasingly shaped by powerful—if sometimes competing—narratives around geopolitics, policy, and technological transformation.
by:Andrew Cates
|in:Economy in Brief
 Global| Jan 29 2026
Charts of the Week: Weaker Dollar, Stronger Tech
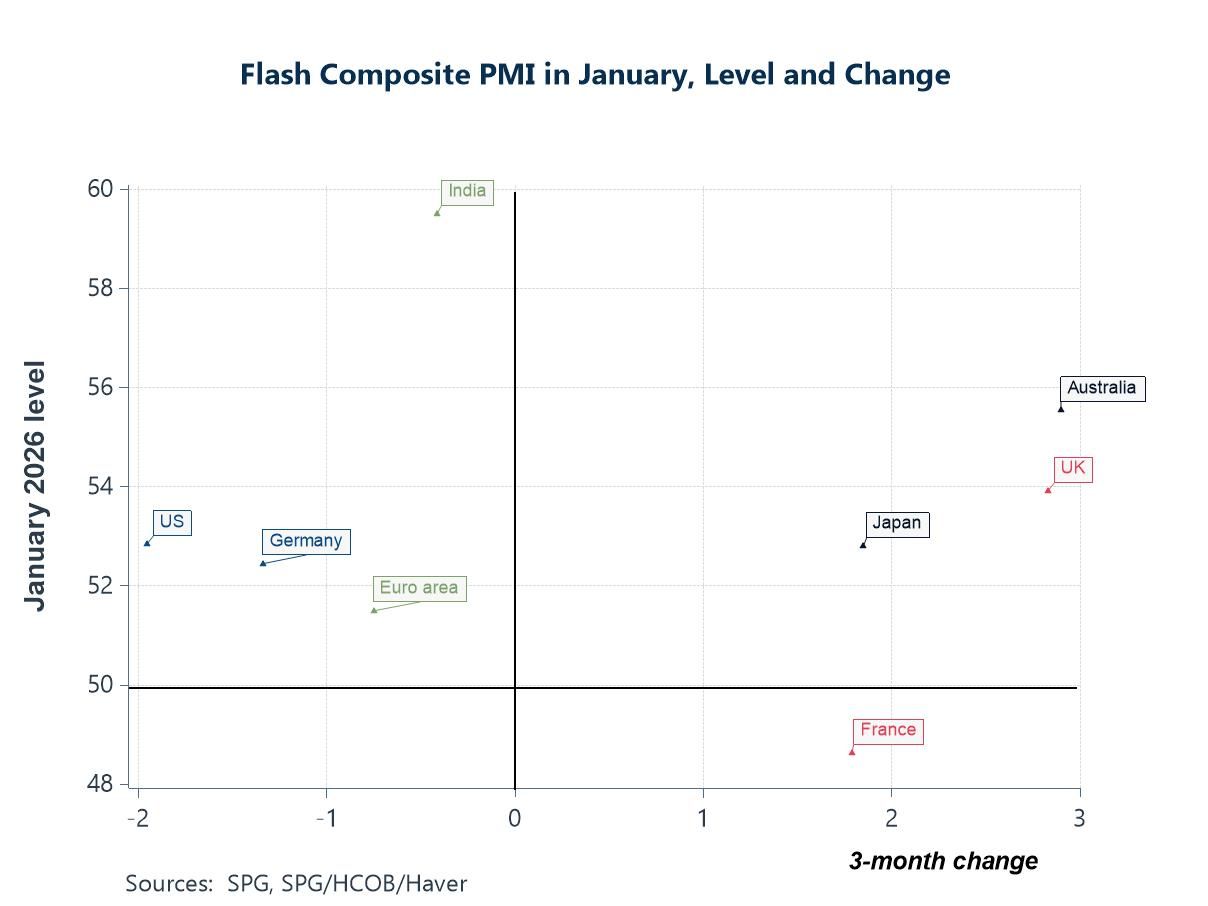
Financial markets have seen renewed gyrations in recent weeks, with a weaker US dollar, higher interest rate volatility and shifting capital flows reviving discussion of a “Sell America” narrative — so far more a marginal rebalancing than a wholesale retreat. The Federal Open Market Committee left the federal funds rate unchanged at its latest meeting, as widely expected, but communications around the outlook for future easing were arguably a little more hawkish than anticipated, reinforcing a cautious and increasingly data-dependent policy stance. In our charts this week we begin with January’s flash PMIs, which point to ongoing expansion across most major economies but with clear cross-country divergence in momentum (chart 1). That uneven real-economy picture has been mirrored in FX: the broad trade-weighted dollar depreciated through the first half of 2025, stabilised later in the year, but has now softened more abruptly at the start of 2026—suggesting a shift in risk premia and capital-flow dynamics (chart 2). Consistent with that, consumer confidence has weakened noticeably in the US relative to the euro area and UK, with the deterioration looking more tied to politics and labour-market perceptions (chart 3). Even so, global equity sentiment has remained comparatively upbeat, supported by a still-favourable macro mix in which global growth surprises have tended to run ahead of expectations while inflation surprises have been softer—tentatively consistent with an improving supply-side backdrop that markets increasingly associate with AI (chart 4). Finally, that theme is reinforced by hard activity indicators: US orders and imports of advanced technology products remain strong (chart 5), and Taiwan’s production data show a parallel surge in electronics output upstream (chart 6), pointing to a still-powerful global tech cycle even as broader macro and market narratives become more unsettled.
by:Andrew Cates
|in:Economy in Brief
- of22Go to 2 page