U.S. Current Account Deficit Narrows in Q3'22
by:Tom Moeller
|in:Economy in Brief
Summary
-
Deficit is smallest in five quarters.
-
Goods deficit narrows sharply as exports grow & imports fall.
-
Services surplus continues to grow.
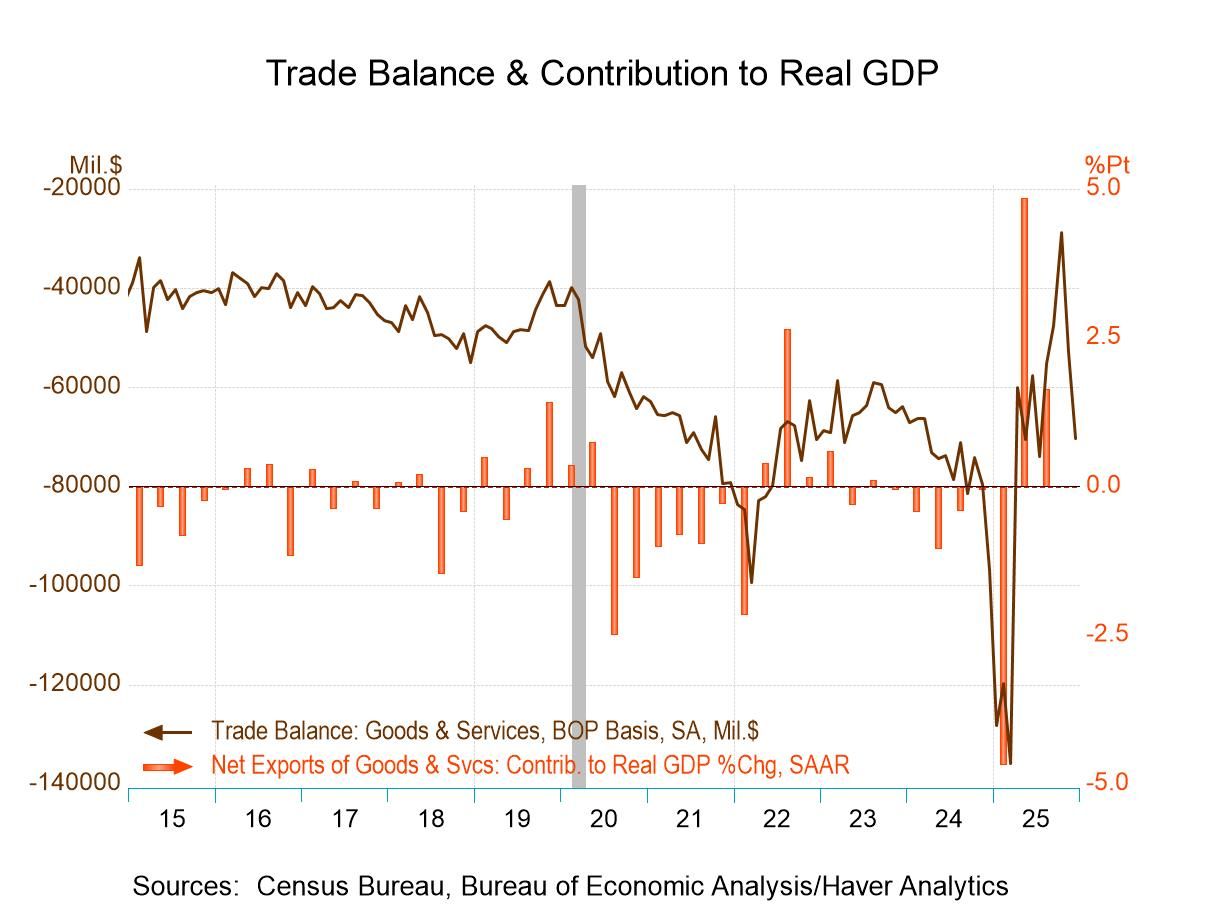
The U.S. current account deficit narrowed in the third quarter to $217.1 billion from $238.7 billion during Q2’22, revised from $251.1 billion. The Action Economics Forecast Survey anticipated a $222.0 billion deficit. It was the smallest deficit since Q2’21. As a percent of GDP, the Q3 deficit contracted to 3.38% from 3.78% in Q2. Exports overall rose 2.4% (19.5% y/y) after an 8.4% gain, while imports edged 0.4% higher (14.9% y/y) following a 3.2% Q2 rise.
The deficit in goods trade narrowed to $271.1 billion after deepening to $310.9 billion in Q2, revised from $310.5 billion. Exports grew 1.3% (23.8% y/y) following a 10.6% Q2 jump. Capital goods exports surged 3.9% (11.9% y/y) while auto exports rose 1.3% (15.6% y/y). These gains were accompanied by a 0.7% rise (9.9% y/y) in nonauto consumer goods exports but offset by a 10.8% decline (+16.8% y/y) in foods, feeds & beverage exports. Industrial supplies & materials exports fell 1.8% (+35.3% y/y).
Imports of goods declined 3.8% (+14.5% y/y) in Q3, following a 2.5% rise in Q2. Auto imports rose 3.3% (22.6% y/y) while capital goods exports gained 1.9% (14.8% y/y). A 9.5% decline (+10.0% y/y) in nonauto consumer goods imports offset these gains while industrial supplies & materials imports fell 5.2% (+22.4% y/y). Foods, feeds & beverage imports also declined 5.2% (+10.0% y/y).
The surplus on services trade improved in Q3 to $60.5 billion from $57.3 billion in Q2. Services exports rose 2.1% (17.2% y/y). Travel exports strengthened 5.4% (104.7% y/y) as tourism rose. Services imports edged 0.9% higher (18.6% y/y) but travel imports rose 5.2% (76.0% y/y). Charges for the use of intellectual property increased 6.6% (4.4% y/y).
The surplus on primary income fell to $45.6 billion in Q3 from $57.2 billion in Q2. Primary income receipts rose 5.1% (17.2% y/y). Primary income payments increased 11.1% (14.5% y/y).
On the capital flow side of the ledger, the net US acquisition of foreign financial assets rose to $411.0 billion in Q3 from $410 billion in Q2. Direct investment assets declined to $56.7 billion from $99.6 billion in Q2.
Balance of Payments data are in Haver's USINT database, with summaries available in USECON. The expectations figure is in the AS1REPNA database.
Tom Moeller
AuthorMore in Author Profile »Prior to joining Haver Analytics in 2000, Mr. Moeller worked as the Economist at Chancellor Capital Management from 1985 to 1999. There, he developed comprehensive economic forecasts and interpreted economic data for equity and fixed income portfolio managers. Also at Chancellor, Mr. Moeller worked as an equity analyst and was responsible for researching and rating companies in the economically sensitive automobile and housing industries for investment in Chancellor’s equity portfolio. Prior to joining Chancellor, Mr. Moeller was an Economist at Citibank from 1979 to 1984. He also analyzed pricing behavior in the metals industry for the Council on Wage and Price Stability in Washington, D.C. In 1999, Mr. Moeller received the award for most accurate forecast from the Forecasters' Club of New York. From 1990 to 1992 he was President of the New York Association for Business Economists. Mr. Moeller earned an M.B.A. in Finance from Fordham University, where he graduated in 1987. He holds a Bachelor of Arts in Economics from George Washington University.


 Global