

 Global| Aug 04 2026
The Real Rate Has Turned — and the World Still Expects the Old Normal
by:Andrew Cates
|in:Viewpoints
For much of the past decade, the working assumption was that interest rates, having collapsed after the financial crisis, would eventually fall back once the latest disturbance had passed. Events are now overturning that assumption—and not only in the United States. Both consensus forecasters and the Federal Reserve's model for estimating the equilibrium rate across advanced economies point to the same conclusion: the real rate of interest—the price of capital after inflation is stripped out—has risen and is likely to remain higher. The question is no longer whether this shift has occurred, but why so much of the financial system is still configured for a world we have left behind.
The evidence is clearest in the United States. The driver is the demand for capital: an investment cycle in artificial intelligence, defence and the reshoring of supply chains is competing for scarce savings, capacity and labour, and that raises the return the economy has to offer to fund it. It now shows up in the forecasts. Over the past six months the Blue Chip consensus for the US policy rate one year ahead has risen by about 44 basis points, while the consensus for inflation over the same horizon has barely changed; only around ten of those basis points reflect higher expected inflation. The remaining 34 are a higher expected real rate. Forecasters are not marking up the price outlook so much as the return on capital the economy can sustain.
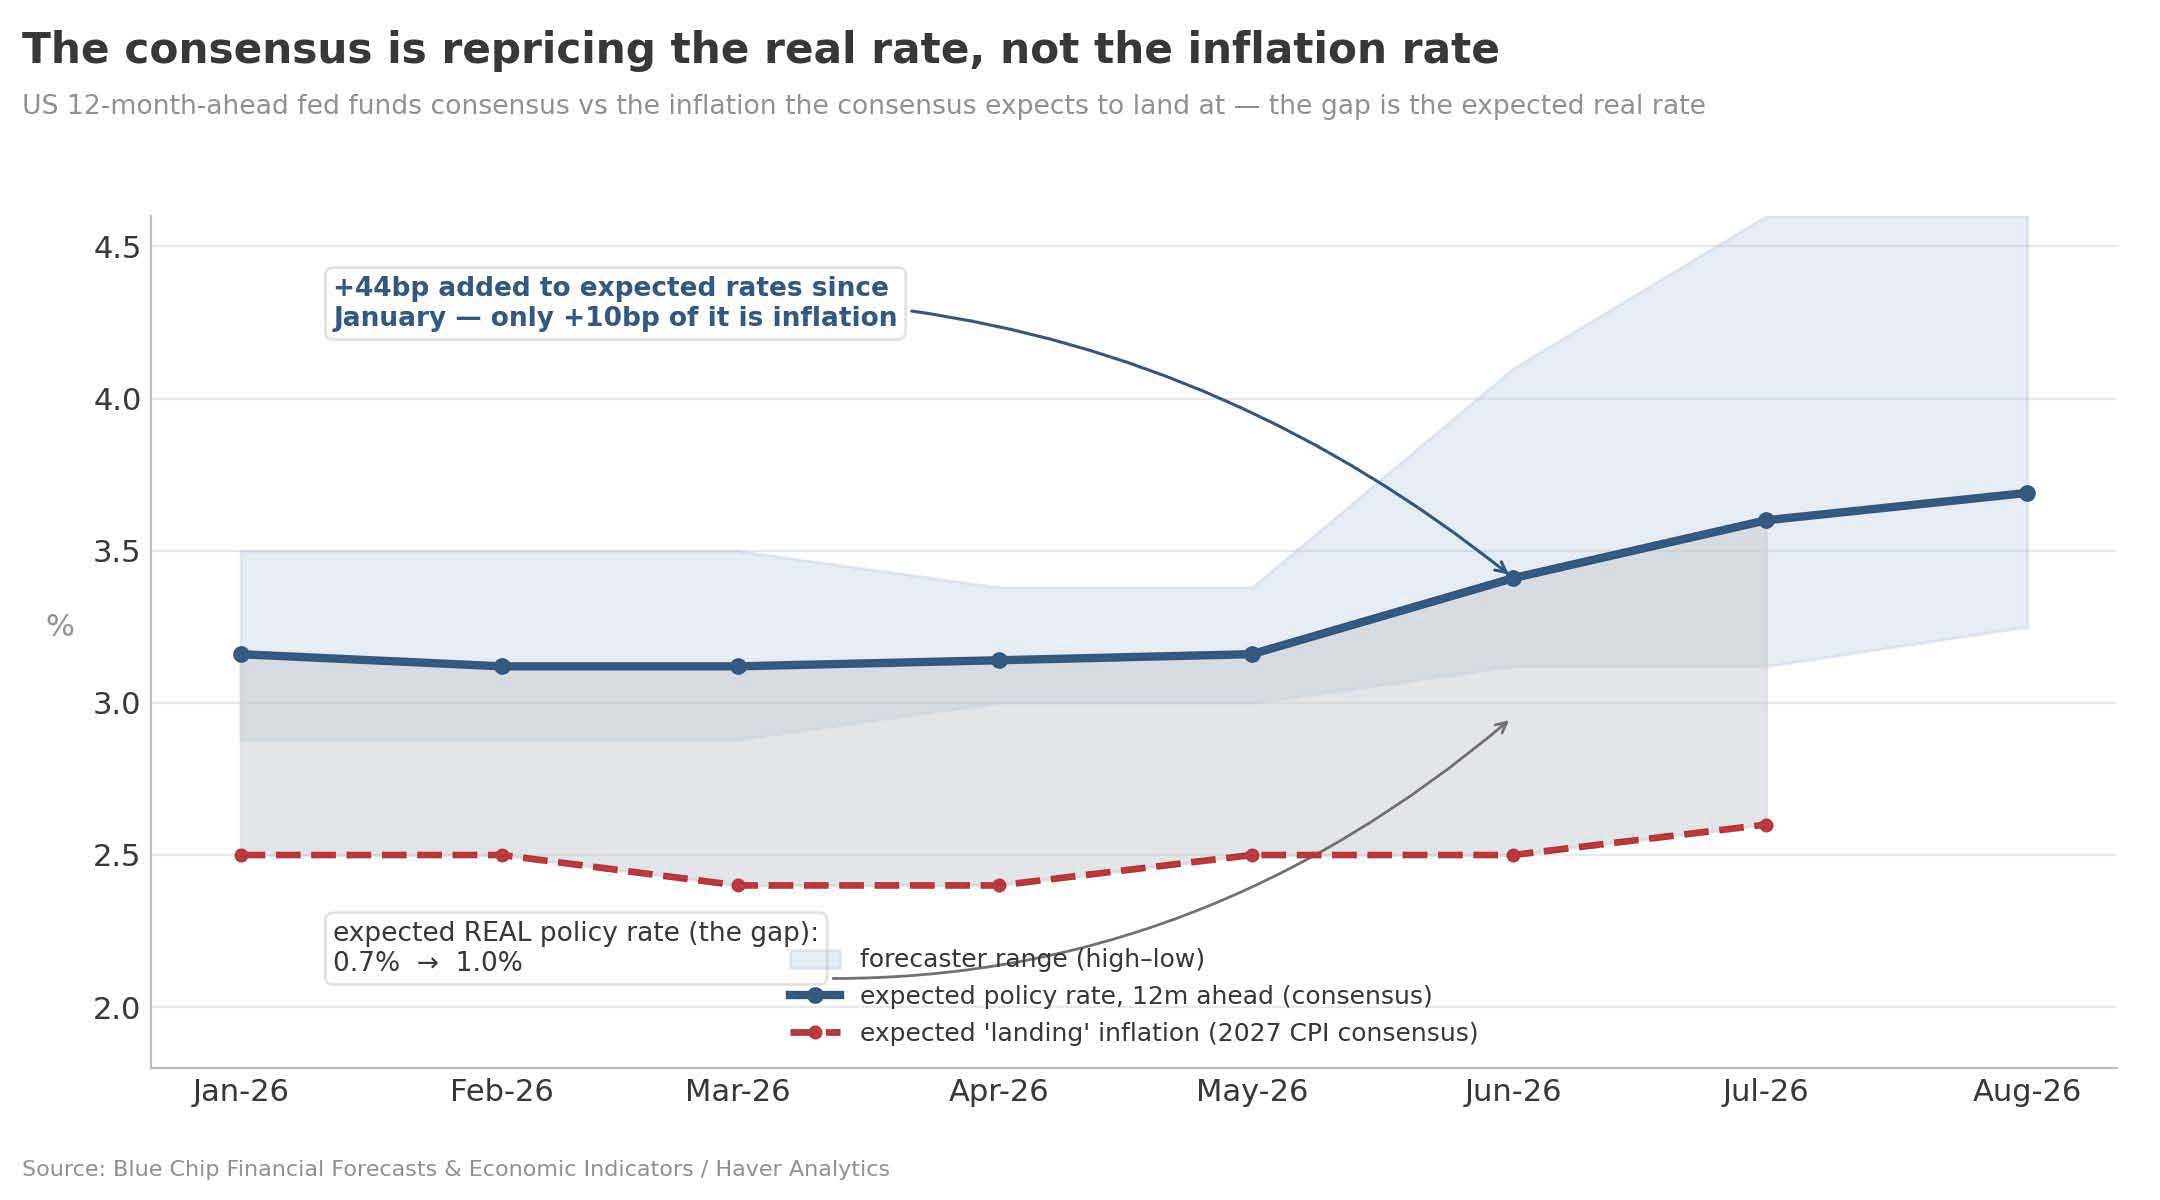
Figure 1. Of the roughly 44 basis points added to the expected US policy rate since January, only about 10 reflect higher inflation; the expected real rate has risen from around 0.7 per cent to 1 per cent. Source: Blue Chip Financial Forecasts & Economic Indicators / Haver Analytics.
Markets still expect rates to fall back Forecasters do not yet appear to believe their own repricing is permanent. Each new survey raises the expected path for policy rates, but every vintage still has rates eventually falling back, toward a long-run level of about 3.25 per cent. A year ago the consensus had the US funds rate down to around 3.3 per cent by the end of 2026; the latest survey has it at 3.5 per cent, and still expected to decline thereafter. The starting point keeps being revised up; the assumption that rates return to a low resting level does not. The same pattern shows up in market pricing in Europe and Australia, not only in the United States.
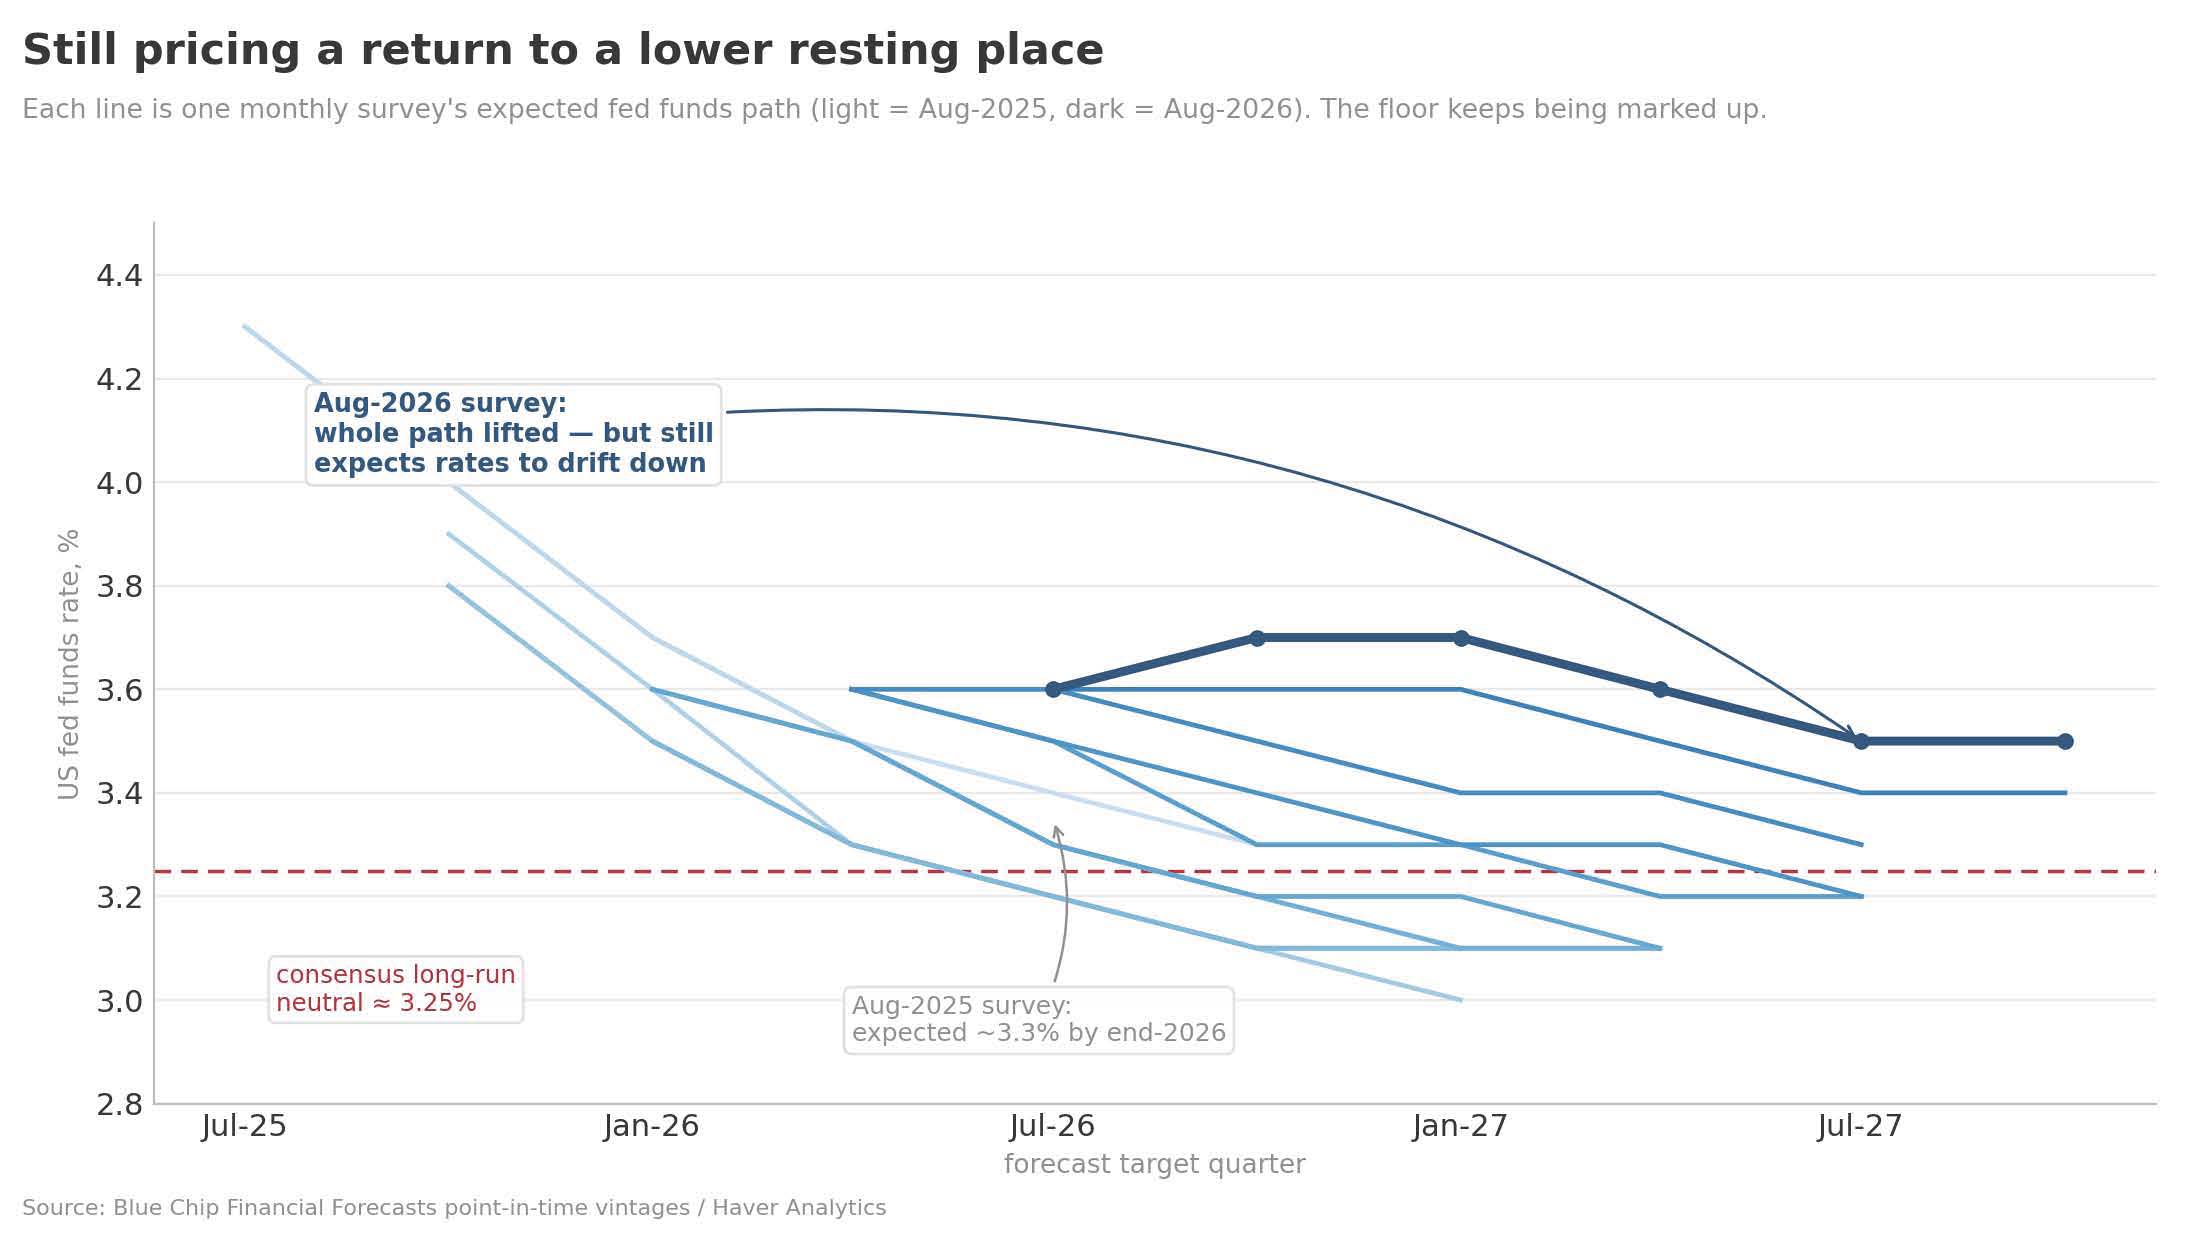
Figure 2. Each line is one month's expected path for the fed funds rate. The floor keeps being marked up, yet every vintage still expects rates eventually to drift back down. Source: Blue Chip Financial Forecasts / Haver Analytics.
Not only a US story This could be dismissed as something particular to the United States — unusually large deficits and an AI boom concentrated in a few American firms. The cross-country evidence says otherwise. The Federal Reserve Board publishes neutral-rate estimates for eleven advanced economies, and their average has followed the same path as the US series: falling for around 25 years to about minus a third of a per cent after the financial crisis, then recovering to roughly 1.2 per cent, the highest since before the crisis.
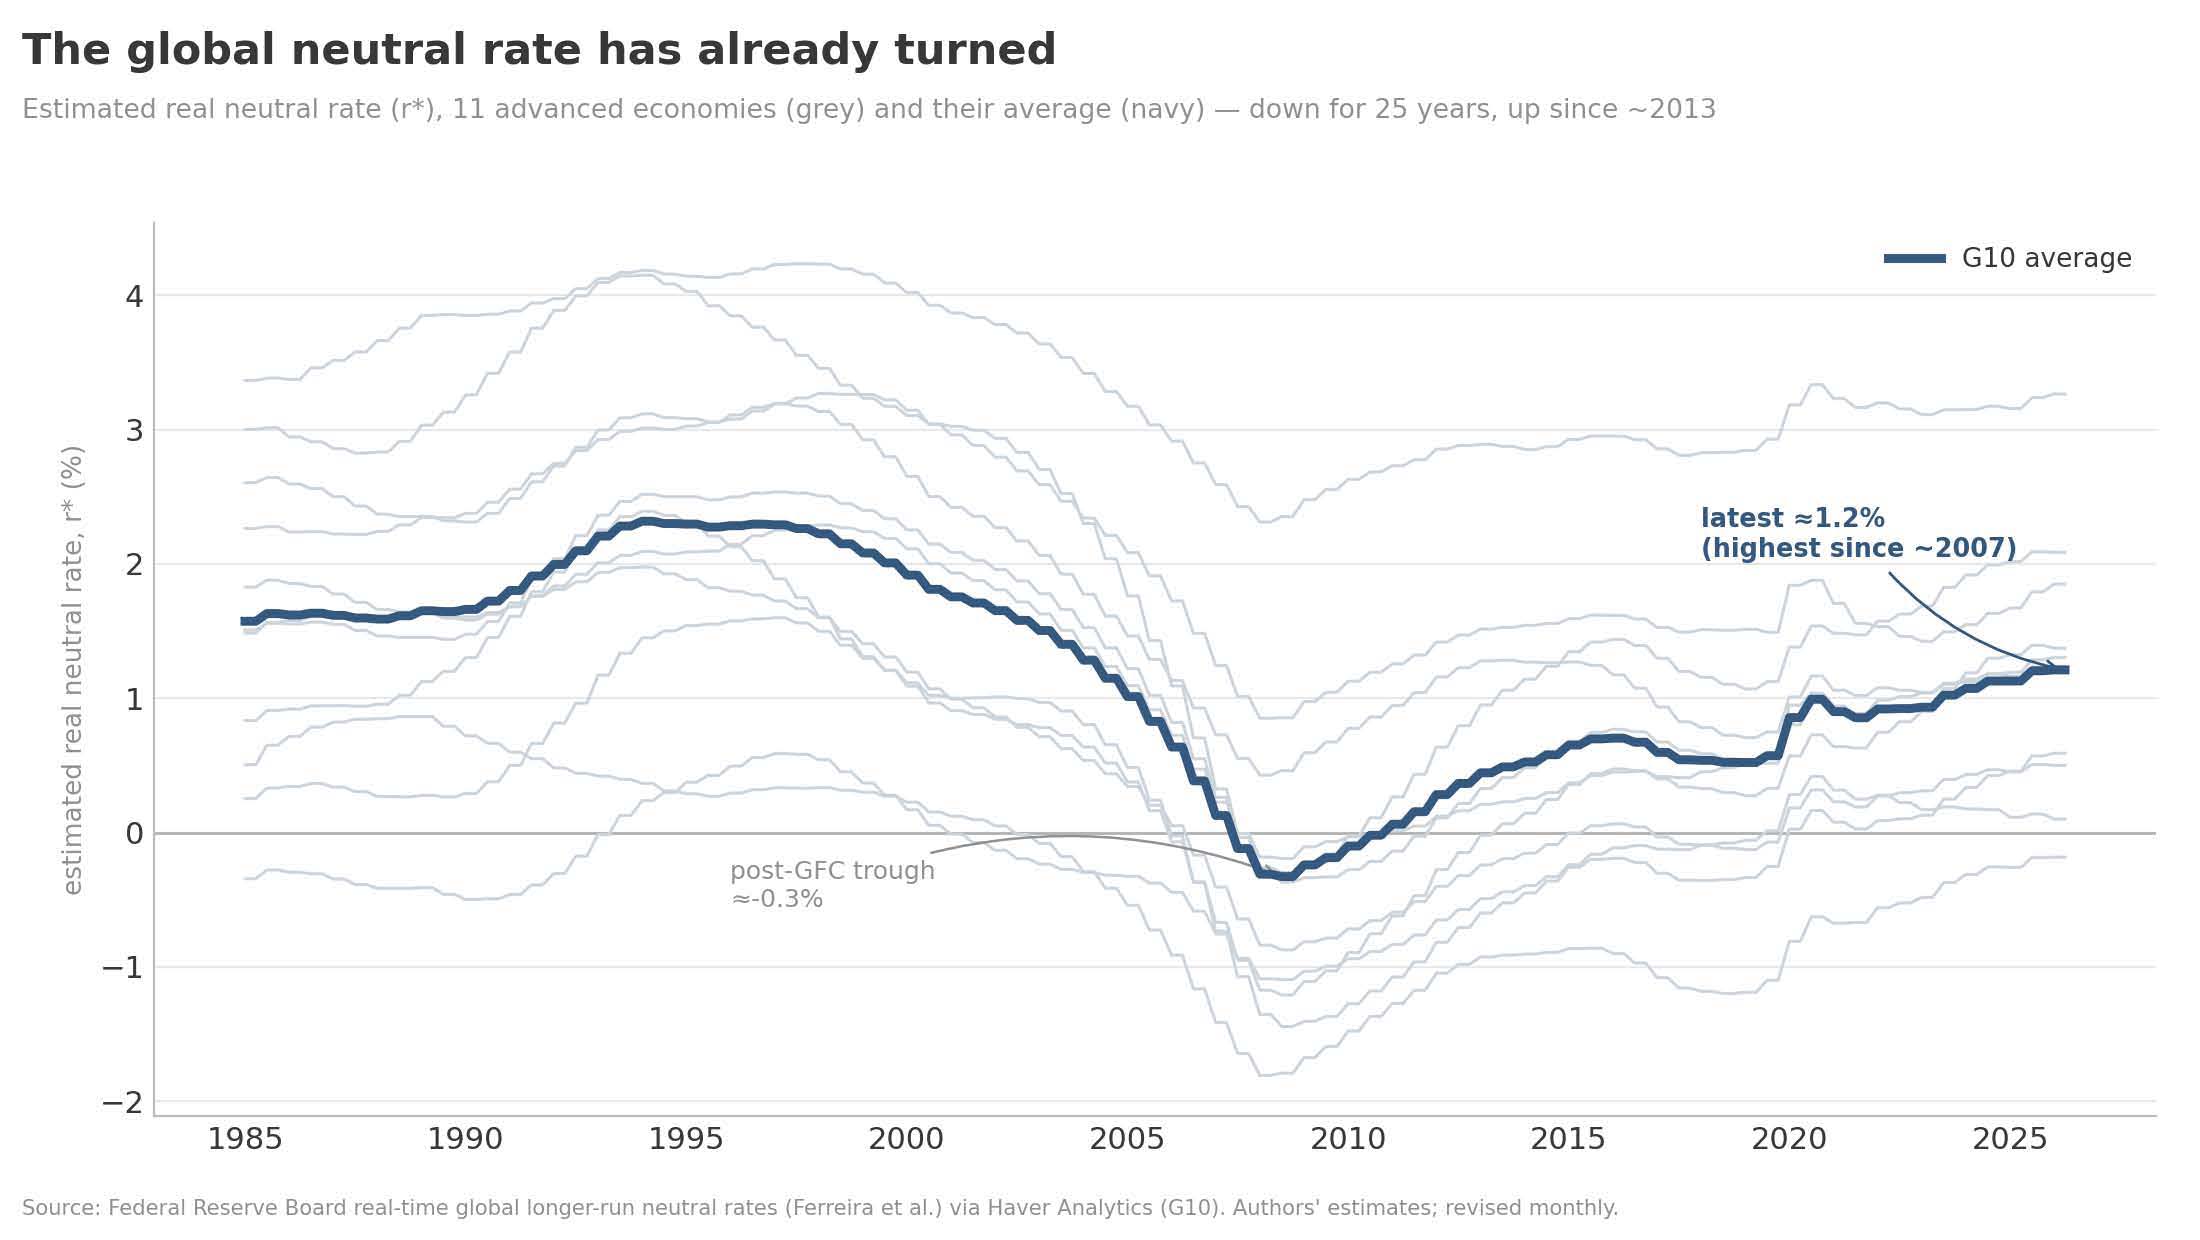
Figure 3. Estimated real neutral rate for eleven advanced economies (grey) and their average (navy). Source: Federal Reserve Board real-time global longer-run neutral rates (Ferreira et al.) via Haver Analytics.
The increase is broad-based. The estimated neutral rate is higher than in 2019 in all eleven economies, ranging from Japan — still below zero, but up by a full percentage point — to New Zealand above 3 per cent.
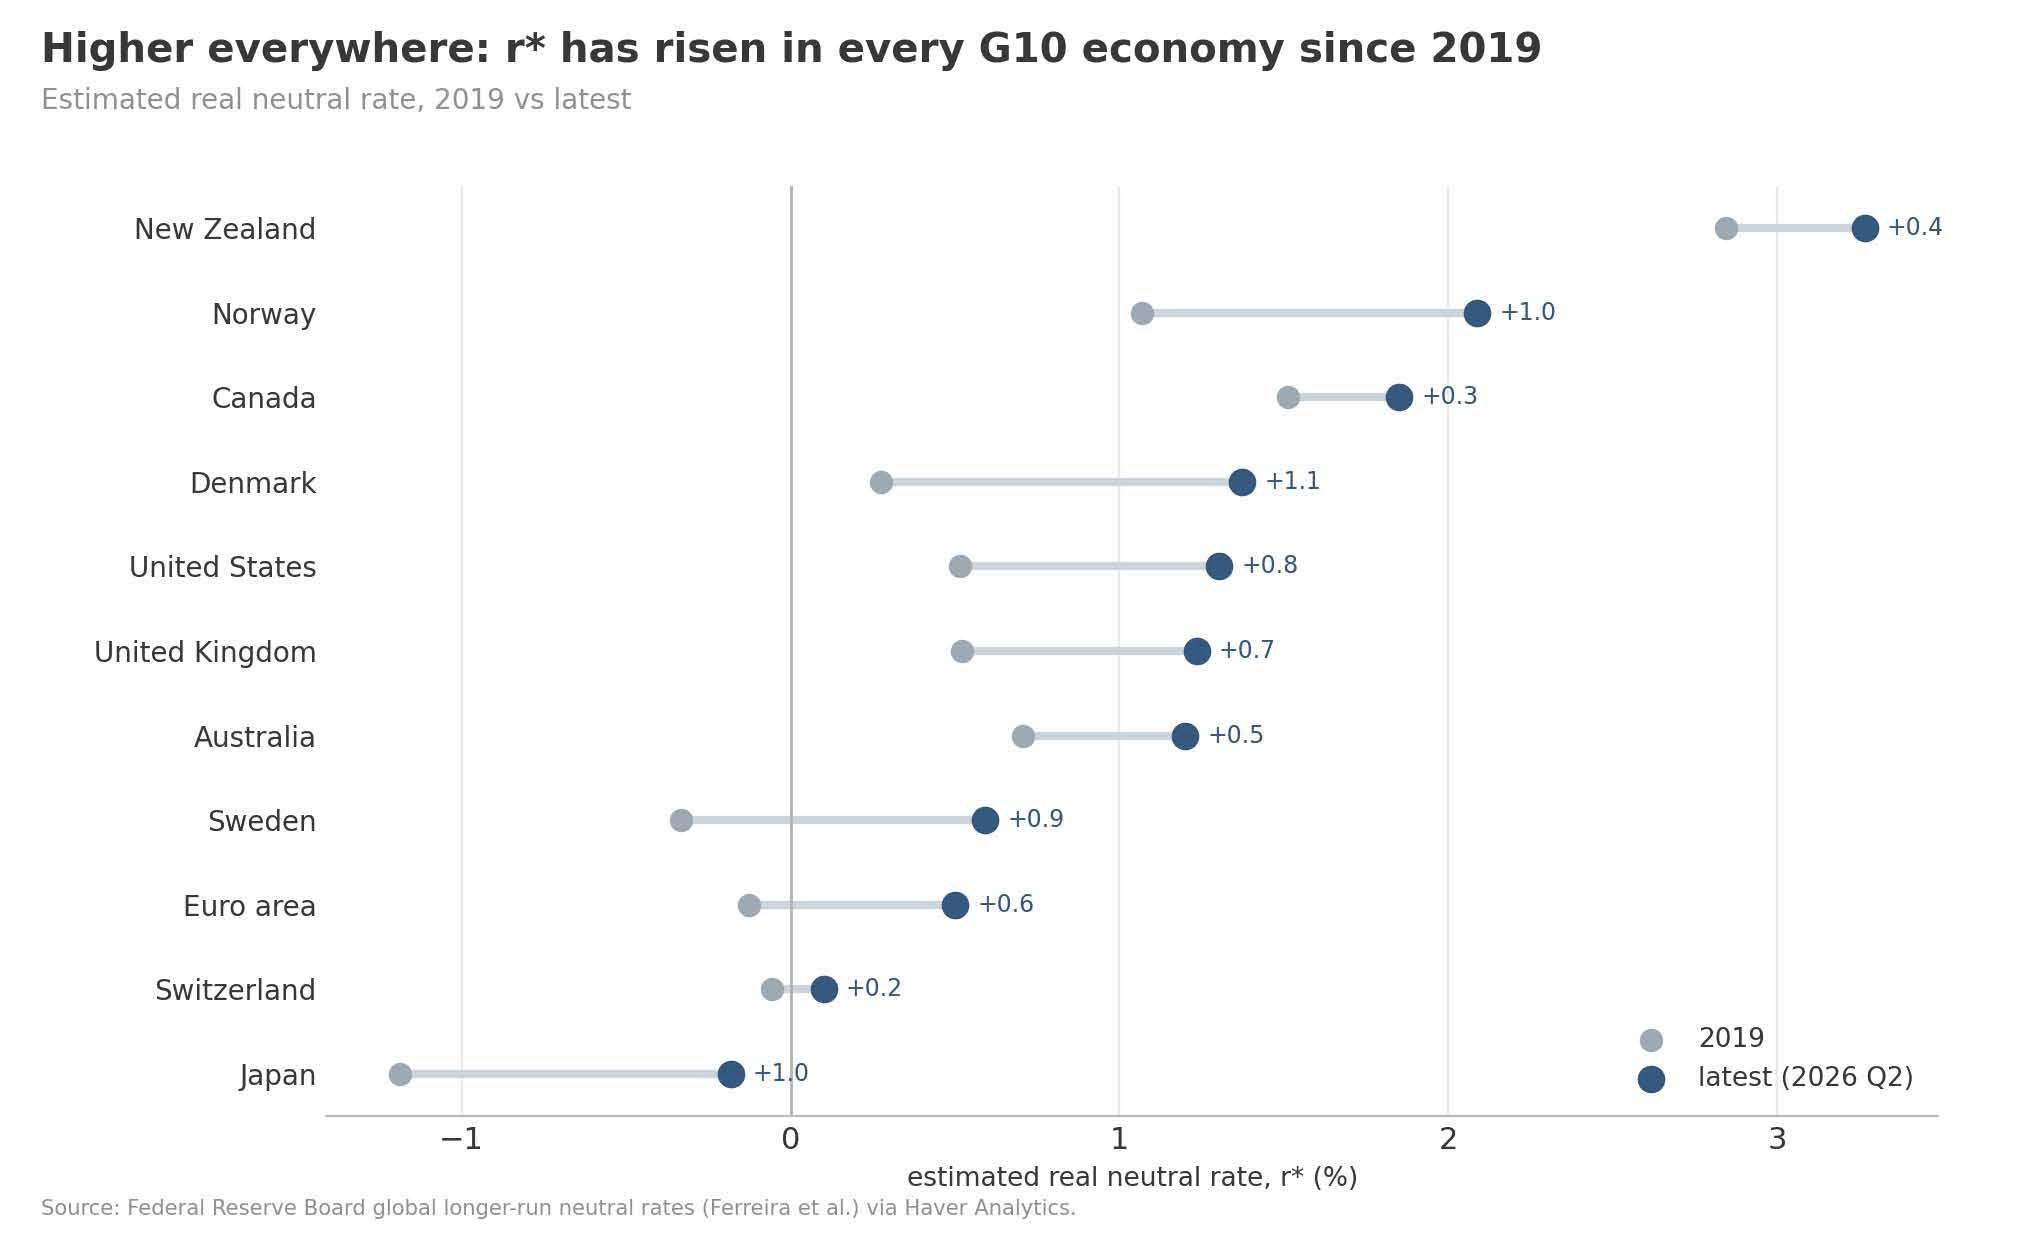
Figure 4. Estimated real neutral rate, 2019 versus latest. Source: Federal Reserve Board global longer-run neutral rates via Haver Analytics.
Rate expectations have shifted in the same direction. Over the past year the consensus for policy rates one year ahead has been revised up in almost every economy — by more than a percentage point for Australia, and by more than half a point for the euro area and Japan. Where in the 2010s the rest of the world converged down towards a low US rate, it is now converging up.
Why the neutral rate has risen What has driven the increase matters for whether it lasts, and here the model is specific. Most of the rise across these economies comes from the growing supply of government debt: as safe assets become more plentiful, their yield has to rise to clear the market. A declining convenience premium on government bonds adds a little more. In the United States a firmer productivity trend contributes as well, though that component is weaker elsewhere. Working the other way are demographics — an ageing population's demand for safe assets — and the slow reversal of the Asian savings surplus that held Western yields down through the 2000s.
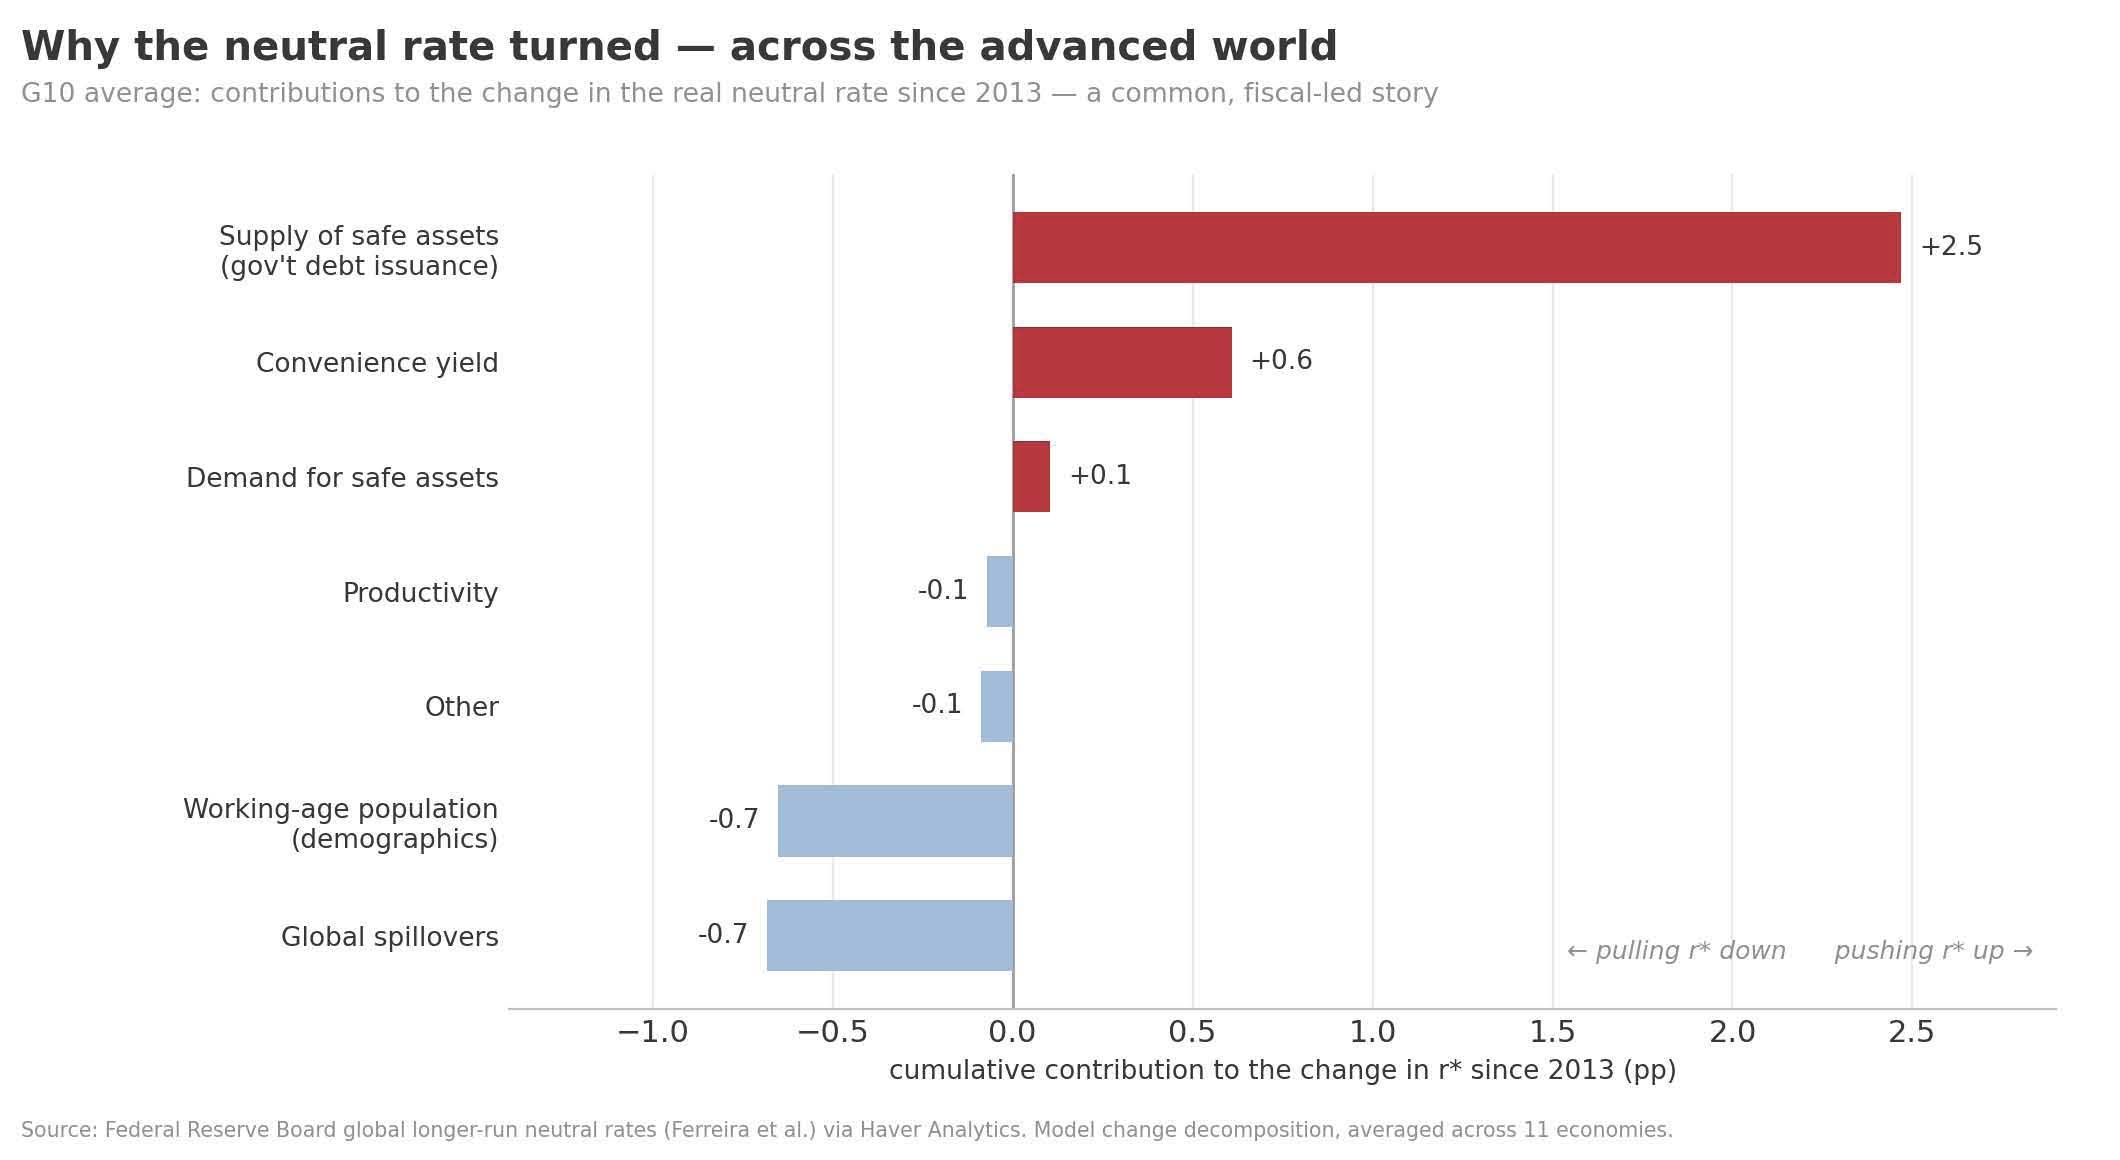
Figure 5. G10-average decomposition of the change in the real neutral rate since 2013. Source: Federal Reserve Board global longer-run neutral rates via Haver Analytics.
These drivers are common across the advanced economies, and none is likely to reverse quickly. Fiscal deficits are large and, on current plans, persistent; demographic change is slow; and if the productivity gains from AI materialise, they will add to the pressure rather than relieve it. That is the case for treating the higher neutral rate as structural rather than cyclical.
Why the old view persists Markets and forecasters have been slow to accept the shift for understandable reasons. Investors and policymakers spent two decades in an environment of steadily falling rates, and expectations formed over that period adjust slowly. The change has come gradually, through small monthly revisions rather than a single identifiable shock, which makes it easy to treat as temporary. And a large stock of asset values — in housing, in equities, in the discount rates embedded in pension and insurance liabilities — rests on the assumption of low real rates, so there are strong incentives to expect that world to return.
What a higher cost of capital means A sustained increase in the real cost of capital has wide consequences, and they will play out over years rather than months. Through the near-zero-rate decade, cheap financing kept alive firms that could not earn their cost of capital, favoured buybacks and other financial engineering over investment, and raised asset prices mainly through falling discount rates rather than rising earnings. A higher real rate reverses those incentives.
The effect on the public finances is the most immediate. The deficits that have contributed to the higher neutral rate now have to be financed at that rate, so interest costs rise even without additional borrowing, and debt sustainability becomes the central constraint on fiscal policy across the advanced world. For companies, a positive real cost of capital raises the hurdle that any investment must clear, the AI build-out included. For pension funds, insurers and other long-horizon investors, a positive real yield on safe assets is welcome after years of reaching for return, but it also implies that the valuations reached in the cheap-money era are more likely to fall than to recover. And when capital is genuinely scarce, the premium on productive, cash-generative assets rises relative to those valued mainly on expected future growth.
What would overturn the argument The argument is testable. It would be weakened by a renewed demographic drag, by a bust in the AI investment cycle, by a recession deep enough to force sharp rate cuts, or by downward revisions to the neutral-rate estimates themselves, which are model-based and change as new data arrive. On present evidence, though, three independent sources point the same way: consensus forecasts are steadily repricing the real rate upward, the Federal Reserve's model shows the neutral rate has already risen across the advanced economies, and the causes are structural. The expectation still embedded in much of the financial system — that rates will return to their post-crisis lows — is increasingly difficult to support.
Charts drawn from the Blue Chip Financial Forecasts (BLUECFIN) and Blue Chip Economic Indicators (BLUECHIP) archives and the Federal Reserve Board's global longer-run neutral-rate estimates (in USECON), all via Haver Analytics.

Andrew Cates
AuthorMore in Author Profile »Andy Cates joined Haver Analytics as a Senior Economist in 2020. Andy has more than 25 years of experience forecasting the global economic outlook and in assessing the implications for policy settings and financial markets. He has held various senior positions in London in a number of Investment Banks including as Head of Developed Markets Economics at Nomura and as Chief Eurozone Economist at RBS. These followed a spell of 21 years as Senior International Economist at UBS, 5 of which were spent in Singapore. Prior to his time in financial services Andy was a UK economist at HM Treasury in London holding positions in the domestic forecasting and macroeconomic modelling units. He has a BA in Economics from the University of York and an MSc in Economics and Econometrics from the University of Southampton.