 Global| Jan 09 2026
The Price of the American Dream
|in:Viewpoints
US voters have not waited for midterm elections—or even a full year—to register their dissatisfaction with Donald Trump’s turbulent return to office. In November last year, Democrats swept key state races in New York, Virginia, and New Jersey. The message from voters was unmistakable: rising living costs and the impact of higher import tariffs are biting hard.
The affordability crisis is already reshaping America’s political landscape. The Financial Times examined the soaring cost of living in New York and the unexpected election of Zohran Mamdani, the 34-year-old Democrat to the office of the mayor. The numbers tell a stark story. Average childcare costs approach US$1,450 per month, yet only 14.5% of New York families can afford them. More than half of renter households spend at least 30% of their income on rent, and between 60,000 and 80,000 New Yorkers sleep in shelters every night.
And New York is far from an outlier.
Recently, a close friend visited us from Boston, and conversation inevitably turned to expenses. Even mundane purchases now come with sticker shock. A simple lunch—sandwiches for two—costs US$30 to US$35. When her German Shepherd needed an X-ray, the bill came to US$1,300; a CT scan was offered for US$3,000. Removing 11 trees from her garden cost US$9,000. She and her husband work in finance and are relatively affluent, so these examples are anecdotal—but they vividly illustrate how sharply costs have risen across the US.
When she insisted on picking up the lunch tab during her visit to the UK, we did not feel too guilty. At £54 with wine (US$71), it was a bargain, even after accounting for the US dollar’s depreciation against sterling.
Both the Financial Times article and these conversations raise important questions. How widespread is the cost-of-living squeeze? How much pressure is Trump under to deliver on his MAGA agenda? And how constrained is the Federal Reserve as it balances rising inflation against already-stretched households?
Income and Spending: A Divided Country
In 2024, the average American took home US$64,426 after taxes, according to data from the Bureau of Economic Analysis (Figure 1). Per capita disposable income exceeded that level in just 18 states. The District of Columbia topped the list at US$92,365, followed by Connecticut at US$80,694. In contrast, residents in 33 states earned less than the national average. Mississippi ranked last at US$47,831, with West Virginia close behind at US$50,444.
Figure 1: US annual disposable income, current US$, by state, 2024
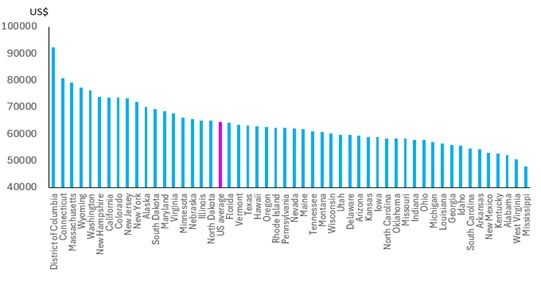
Source: BEA and Westbourne Research
In other words, nearly two-thirds of US states have average take-home pay below the national mean, and the gap between the highest- and lowest-earning states is a staggering 48%.
Unsurprisingly, states with the highest disposable incomes are also the biggest spenders (Figure 2). In 2024, per capita consumption in the District of Columbia reached US$93,713, compared with a national average of US$58,499—a difference of 60%. Nineteen states spent above the national average, while 31 fell below it. Mississippi again ranked lowest at US$43,947, followed by Arkansas at US$46,259.
Figure 2: US annual consumption expenditure, current US$, by state, 2024
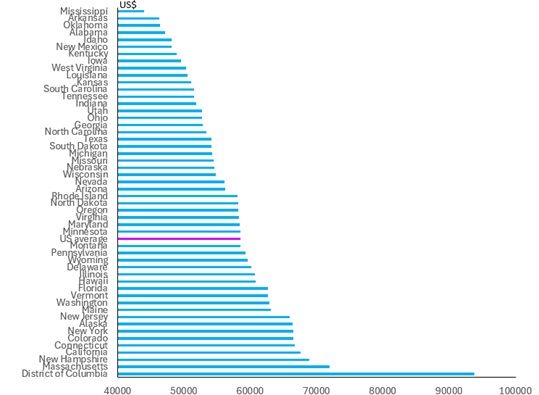
Source: BEA and Westbourne Research
While US wages—especially at the professional high end—are significantly higher than in countries such as the UK, the issue is not merely that Americans spend more in nominal terms. It is the sheer scale of the difference, which is becoming increasingly visible in household budgets.
During another recent visit, a cousin from the US was touring UK universities with his wife and teenage son. He explained that putting his son through three years of graduate school in the US would cost roughly US$400,000. By comparison, international tuition fees in the UK typically range from £33,000 to £105,000 (US$43,000–US$138,000). He was, unsurprisingly, hoping his son would be accepted by a British university.
Housing, Childcare, and the Urban Squeeze
Living in major metropolitan areas is particularly punishing. In 2023, the average New Yorker devoted 38% of total expenditure to housing. In Los Angeles the figure was 37%, and in Chicago 34%.
According to the Department of Health and Human Services poverty guidelines, in 2025 a single parent living in San Francisco would need to earn US$105,751 a year. Of that income, around 35% would go on housing, 23% on childcare, nearly 10% on medical expenses, 8% on transportation, and 8% on food. For a household with two adults and one child, the required income rises to US$115,803—yet even then, housing would absorb 32% of after-tax income, childcare 21%, and food more than 11%.
This is against a backdrop where average per capita disposable income in California stands at US$73,684. The arithmetic simply does not add up for many households.
Spending Beyond Means
To assess the pressure more systematically, we examined the ratio of per capita personal consumption expenditure to per capita disposable income in 2024. A ratio of 1.0 or higher indicates that households are spending all—or more—than they earn, either by running down savings or taking on debt.
Nationally, the ratio stands at 0.90, meaning the average American spends 90% of disposable income (Figure 3). We consider a ratio closer to 0.8 a sign that households are under less strain and able to save meaningfully. Only 24 states meet or beat the national average. Wyoming fares best at 0.77, followed by South Dakota and Oklahoma.
At the other end of the spectrum are Maine, the District of Columbia, and Delaware, where spending exceeds disposable income. In total, 27 states have ratios above the national average—clear evidence that financial pressure is widespread.
Figure 3: Personal expenditure to disposable income ratio, 2024
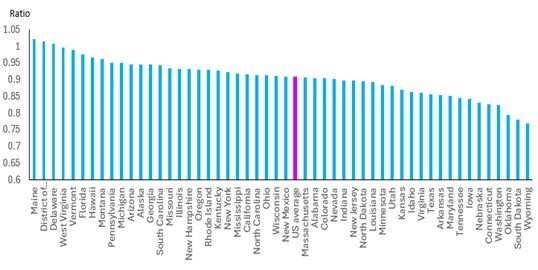
Source: BEA and Westbourne Research
The picture looks even bleaker in real terms (Figure 4). Over the period 2019–2023, real consumption growth outpaced real income growth in 34 states and nationally. In other words, purchasing power has eroded across much of the country for several years.
Figure 4: Real income minus real consumption, cumulative change, 2019-23
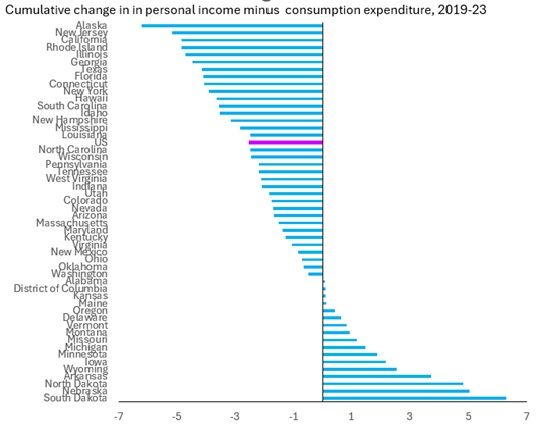
Source: BEA and Westbourne Research
Politics, Policy, and the Fed’s Dilemma
This backdrop helps explain why Trump has shifted away from a “big bang” deregulation agenda or aggressive corporate tax cuts. Instead, his “One Big Beautiful Folly Bill” focuses on demand-side stimulus and household income relief—despite the irony that the lowest-income households may benefit least.
The cost-of-living crisis is also why Trump will prioritise a domestically focused MAGA agenda this year. As for the Federal Reserve, the central cut the Fed Funds rate by 75bps in 2025 but the political pressure to ease monetary policy further remains especially with consumer price inflation easing off in November.
Does this change our assessment of the US economy or our investment stance? The short answer is no. Business-cycle indicators—including profit and investment cycles—point to stronger growth in 2026. Fiscal policy remains supportive, with households set to benefit by an estimated US$3.1 trillion through tax cuts and cash transfers. Monetary policy, meanwhile, is easing.
We remain overweight US equities and expect the rally to broaden. Any near-term correction would likely be healthy rather than destabilising.
That optimism is supported by earnings data. Third-quarter US earnings growth has been both strong and broad-based. Median year-on-year earnings growth across the Russell 3000 reached 11%. Six of the eleven sectors in the S&P 500 reported positive average earnings growth, with utilities, real estate, and industrials posting robust sales growth and expanding margins.
For households, living in the US increasingly hurts. For investors, however, the outlook remains more resilient than the politics might suggest.

Sharmila Whelan
AuthorMore in Author Profile »The founder of Westbourne Research (www.westbourne-research.com), Sharmila Whelan is a seasoned Global Geopolitical-Macro Strategist with nearly three decades of experience advising buy-side clients on multi-asset investment strategies and asset allocations. Her career has been defined by her differentiated thinking, a deep understanding of the intricate connections between global geopolitics, macro and policy dynamics, and the Austrian business cycle approach to economic analysis. She has counseled governmental bodies such as the CIA, the US State Department, the British High Commission, DFID, and China’s NDRC.
Sharmila has held prominent roles in both London and Hong Kong, serving as Managing Director at Aletheia Capital, Director at Merrill Lynch Bank of America, Senior Economist at CLSA, and Asia Regional Economist at BP Plc. In 2022, Bloomberg recognised her as one of the UK's "12 New Expert Voices." She is a frequent media commentator on Bloomberg TV and radio, BBC World Business News, and CNBC, and is a sought-after speaker at high-profile events such as the Financial Times Wealth Summit and CFA UK & India conferences. Sharmila also contributes opinion pieces to Financial Times Professional Wealth Management and the Economist Group’s EIU.