

 Global| Aug 03 2026
The Market CanNOT Tighten for the Fed
|in:Viewpoints
At his news conference on July 29, 2026, Fed Chairman Warsh stated that even though the FOMC had not made any policy changes since he was piped aboard the Board, market interest rates had risen, which he interpreted as “the market” tightening monetary policy. I will argue in this commentary that the market cannot tighten for the Fed or the FOMC. Rather, perhaps counterintuitively, I will argue that an increase in market interest rates in the absence of an increase in the federal funds rate represents an easing in monetary policy.
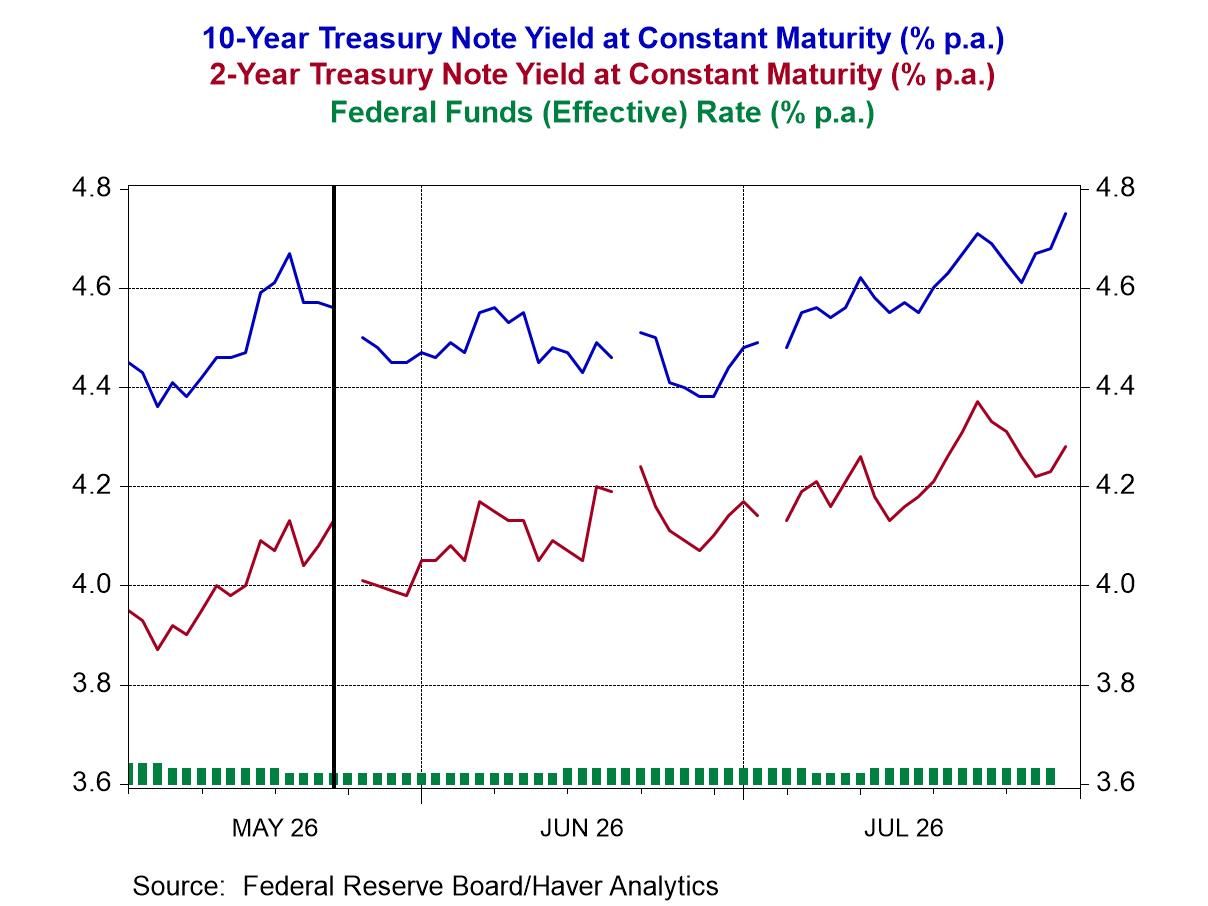
Plotted in Chart 1 are the daily observations of the yields on the Treasury 10-year, 2-year notes along with the effective federal funds rate from May 2026 through the most current. Warsh was sworn in as Federal Board chairman on May 22, 2026. From May 22 through July 31, the yield on the 10-year Treasury note increased a net 11 basis points. The yield on the Treasury 2- year note increased a net 15 basis points. And the effective federal funds rate increased a net 1 basis point from May 22 through July 30. So, versus the federal funds rate, the yield curve steepened.
Chart 1
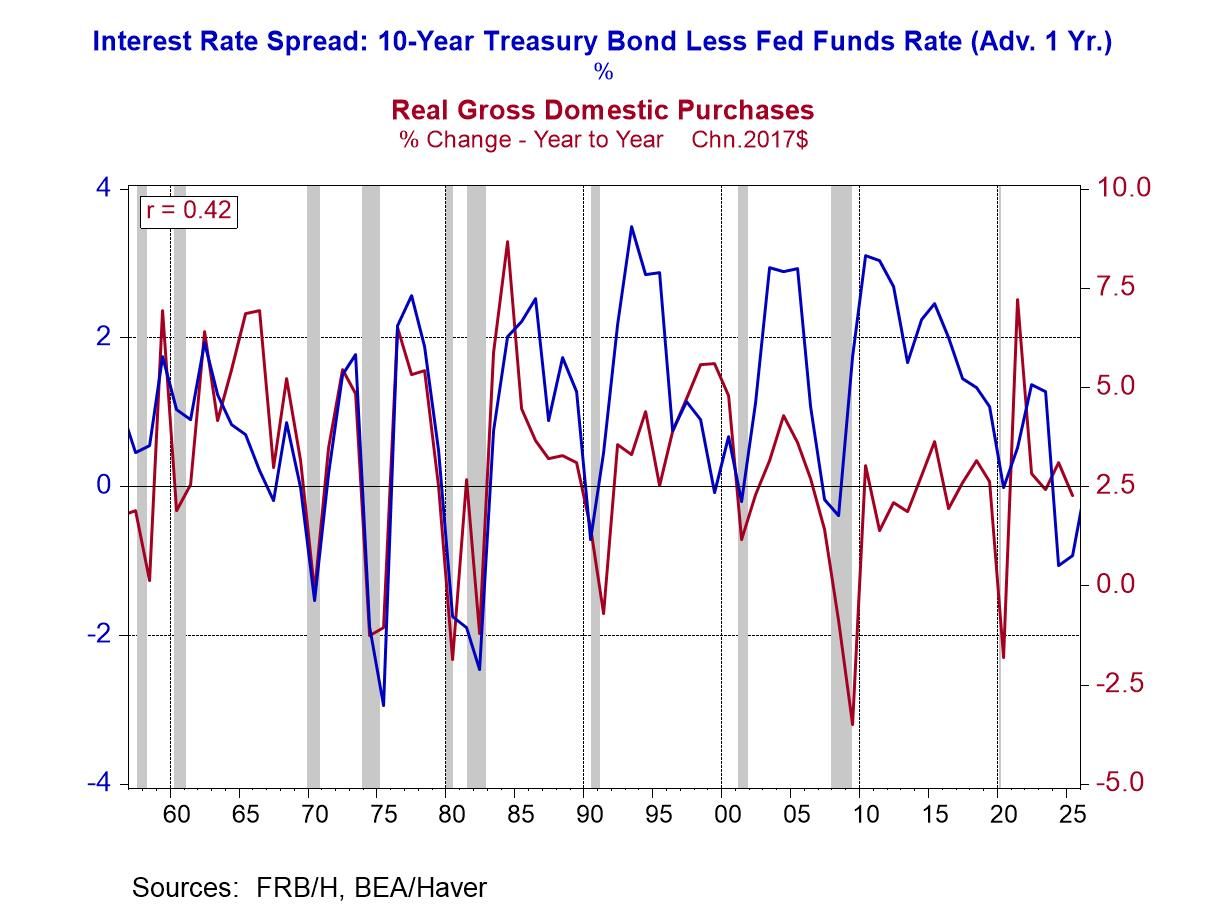
Plotted in Chart 2 are the annual average observations of the percentage-point spread between the yield on the Treasury 10-year note and the federal funds rate (the blue bars) and the level of the federal funds rate (the red line). The gray shaded areas demarcate periods of economic recession. Notice that when the federal funds rate trends higher, the yield spread between the Treasury 10-year note and the federal funds rate trends lower, or narrows. Conversely, when the federal funds rate trends lower, the spread between the Treasury 10-year note tends to widen. Notice also, that prior to periods of economic recession, the yield spread narrows or turns negative. And again, conversely, during periods of economic recovery/expansion, the yield spread widens. The spread between the yield on the Treasury 10-year note and the federal funds rate is a leading indicator of the behavior of real economic activity. A widening spread suggests faster growth in real economic activity. A narrowing in the spread suggests slower growth in real economic activity. Robert D. Laurent, may he rest in peace and his memory be a blessing, an economist at the Federal Reserve Bank of Chicago, did the seminal research on this yield spread’s relationship to the behavior of real economic behavior (“An Interest Rate-Based Indicator of Monetary Policy”). Subsequent to Laurent’s research, the Conference Board added the spread to its Index of Leading Economic Indicators. Plotted in Chart 3 are the annual averages of the yield spread between the Treasury 10-year note and the federal funds rate and the percent changes in annual average real Gross Domestic Purchases. The yield spread is advanced by one year. The correlation coefficient between the two series is +0.42. The correlation coefficient has the “correct” sign, positive, indicating that when the yield spread widens, one year later growth in real Gross Domestic Purchases increases.
Chart 2
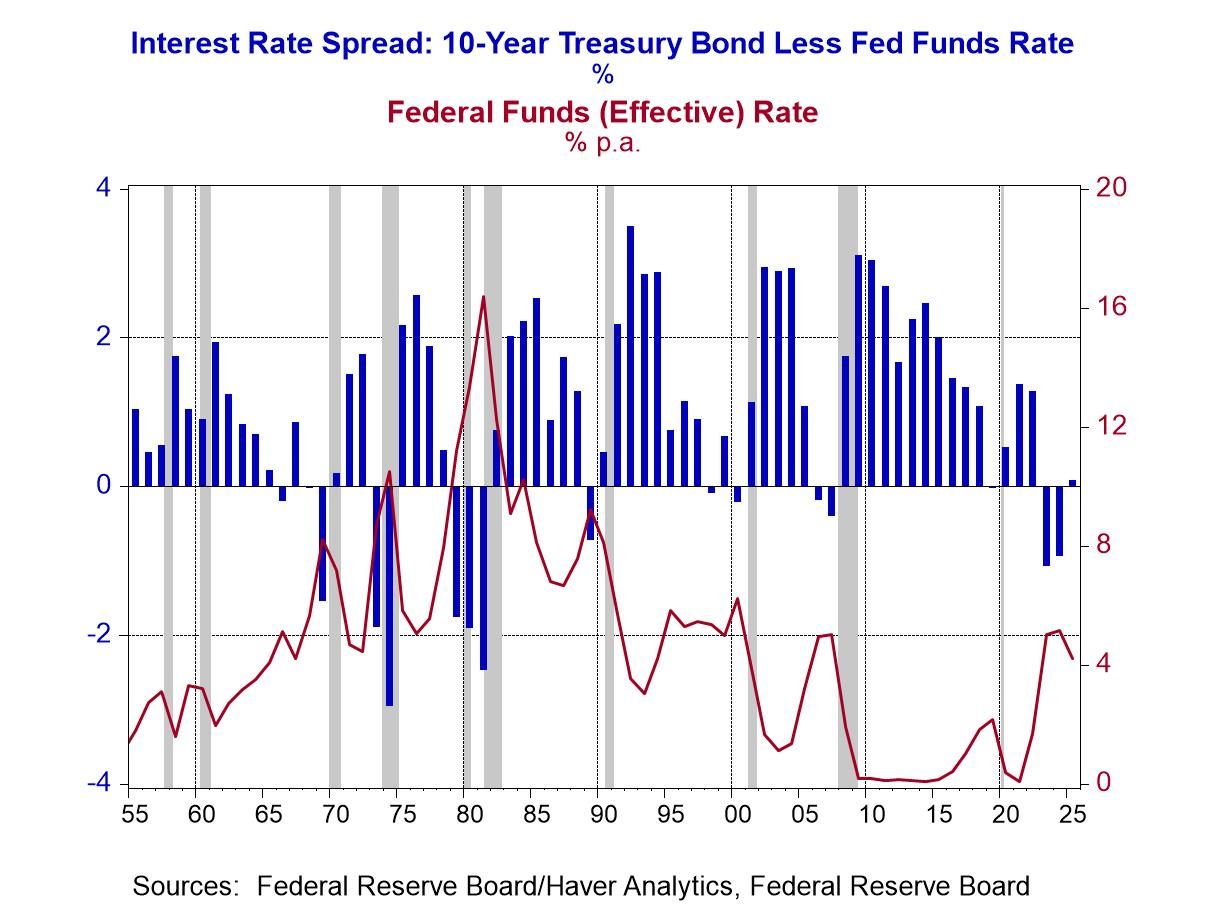
Chart 3
The “theory” behind the relationship between the yield spread and the behavior of real economic activity is related to the behavior of the lending by the depository institution system (commercial banks and thrift institutions) in response to changes in the yield spread. The federal funds rate represents the marginal cost of funds for a bank. If interest rates farther out along the yield curve increase, all else the same, banks have an increased incentive to extend new credit. Although yields in the shorter end of the yield curve are affected by the future expected levels of the federal funds rate, this effect on the level of a 10-year yield is de minimis. Rather, the behavior of the yield on a 10-year maturity is affected by the supply and demand for credit in general. For example, if the demand for credit rises relative to the supply, the yield on a10-year security will increase. In fact, yields all along the yield curve would “want” to increase. But if the FOMC has pegged the federal funds rate at a certain level and is not expected to raise that level in the foreseeable future, then yields at the shorter end of the yield curve will not increase, or, will not increase as much as those farther out along the yield curve. Under these circumstances, the increased in the demand for credit, which is not being satisfied by aggregate saving, will be satisfied by an increase in the supply of credit advanced by the banking system. Again, Robert D. Laurent explains all of this and much more in “Term-Structure Spreads, the Money Supply Mechanism, and Indicators of Monetary Policy”.
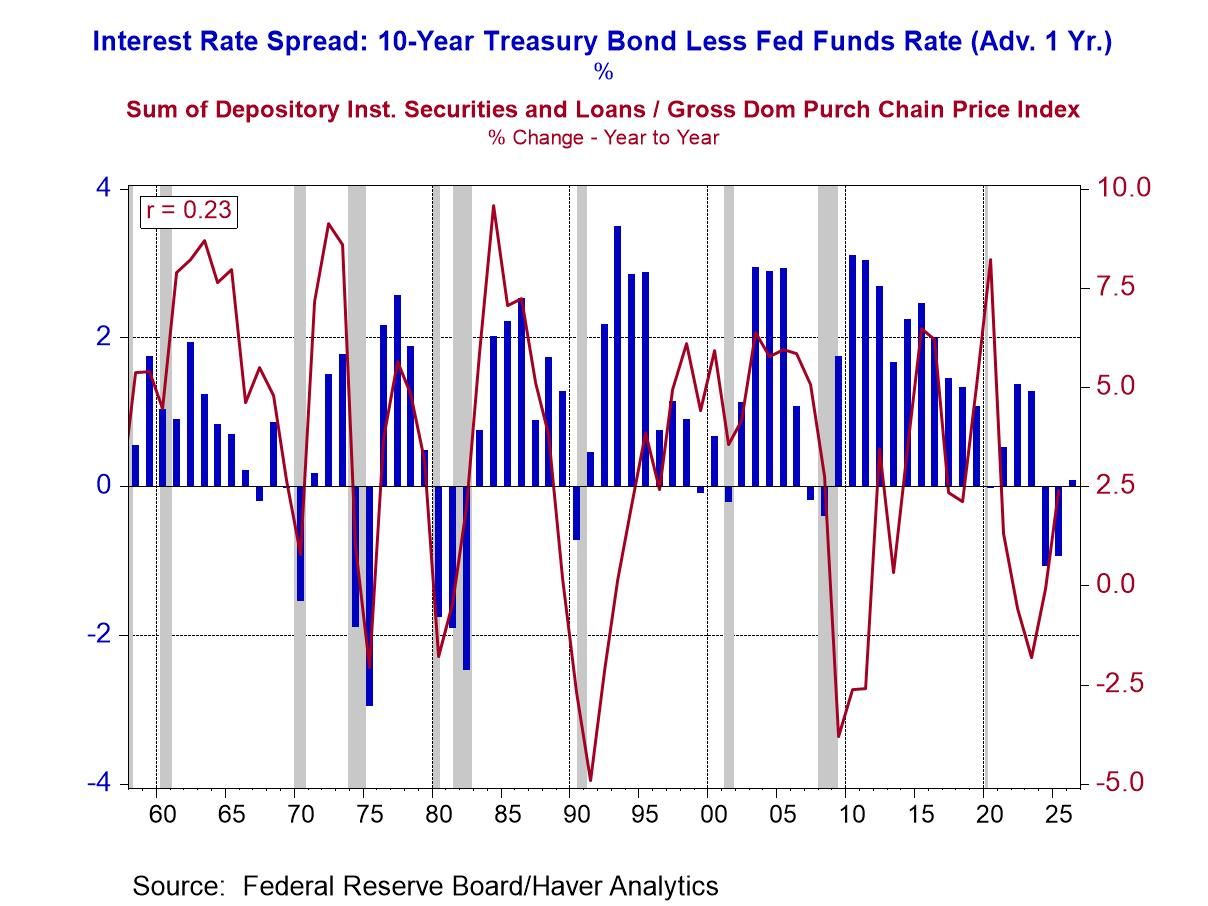
Plotted in Chart 4 are the average annual averages of the yield spread between the Treasury 10-year note and the federal funds rate, advanced by one year (blue bars) and the percent changes in the annual average sum of depository securities and loans deflated by the Gross Domestic Purchases chain-price index (the red line). With some notable exceptions, there is a positive correlation between the yield spread advanced by one year and the percent changes in real depository institution credit. The notable exceptions are in the early 1990s and the 2010s. These were two periods when depository institutions were experiencing capital inadequacy. Depository institutions might have wanted to satisfy increased credit demand, but they could not because they had inadequate capital to support additional earning assets. These two periods are responsible for the low value of the correlation coefficient, 0.23.
Chart 4
Historically, then, increased interest rates relative to the federal funds rate has been associated with increased banking system lending and increased growth in real economic activity. So, if Chairman Warsh believes that the recent increase in interest rates relative to the level of the federal funds rate represents a “tightening” in monetary policy, his view is at odds with empirical evidence and economic theory.

Paul L. Kasriel
AuthorMore in Author Profile »Mr. Kasriel is founder of Econtrarian, LLC, an economic-analysis consulting firm. Paul’s economic commentaries can be read on his blog, The Econtrarian. After 25 years of employment at The Northern Trust Company of Chicago, Paul retired from the chief economist position at the end of April 2012. Prior to joining The Northern Trust Company in August 1986, Paul was on the official staff of the Federal Reserve Bank of Chicago in the economic research department. Paul is a recipient of the annual Lawrence R. Klein award for the most accurate economic forecast over a four-year period among the approximately 50 participants in the Blue Chip Economic Indicators forecast survey. In January 2009, both The Wall Street Journal and Forbes cited Paul as one of the few economists who identified early on the formation of the housing bubble and the economic and financial market havoc that would ensue after the bubble inevitably burst. Under Paul’s leadership, The Northern Trust’s economic website was ranked in the top ten “most interesting” by The Wall Street Journal. Paul is the co-author of a book entitled Seven Indicators That Move Markets (McGraw-Hill, 2002). Paul resides on the beautiful peninsula of Door County, Wisconsin where he sails his salty 1967 Pearson Commander 26, sings in a community choir and struggles to learn how to play the bass guitar (actually the bass ukulele). Paul can be contacted by email at econtrarian@gmail.com or by telephone at 1-920-559-0375.