Payroll Employment: Another Surprise in March, The Third Consecutive
Summary
- The jump of 178,000 in payroll employment in March easily exceeded the expected gain of 51,000.
- Following a net gain in January and February, the employment setting seems to have brightened slightly.
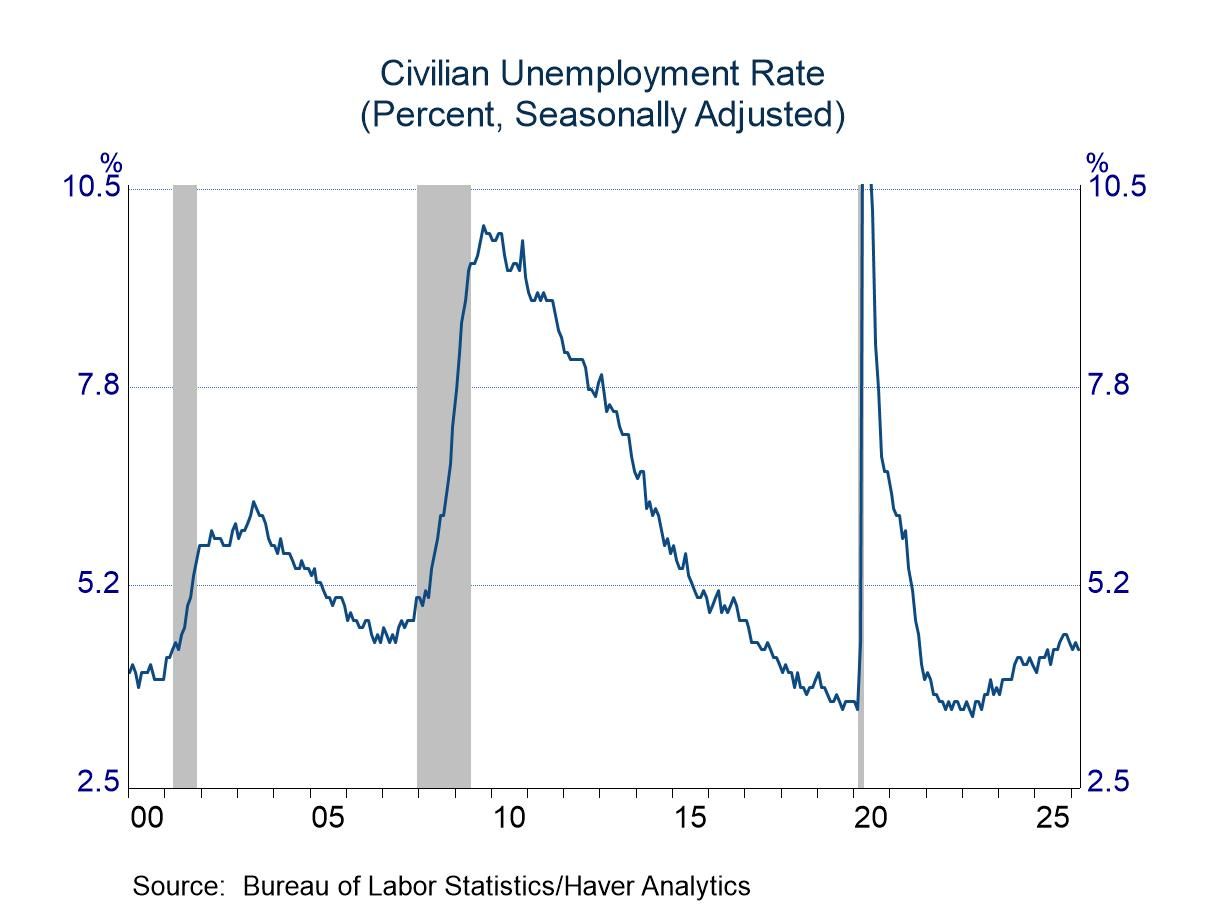
- A dip in the unemployment rate continued the recent pattern of marginal changes.
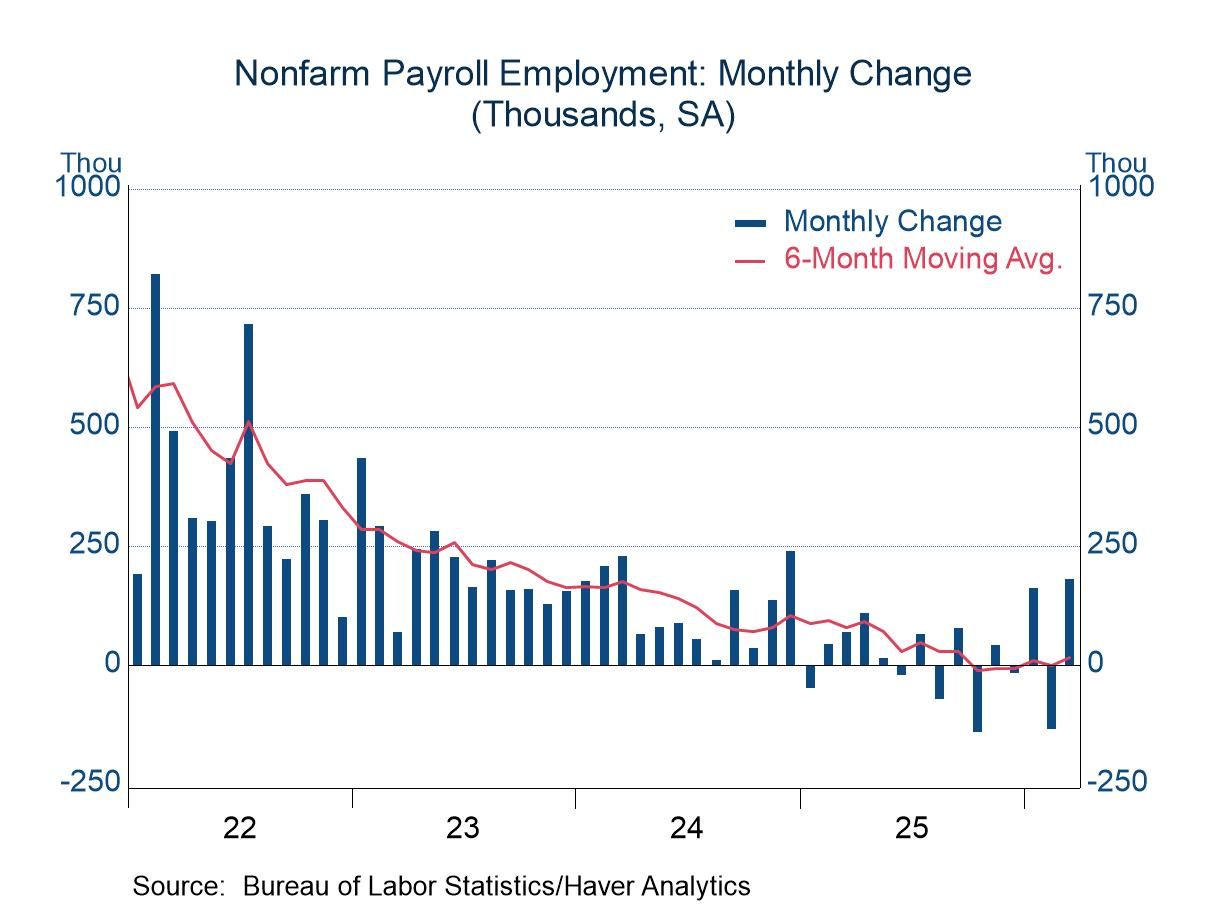
The report on payroll employment for March was impressive when viewed in isolation. Job growth was strong at 178,000, and the advance was broadly based. The construction and manufacturing sectors both posted solid gains, and the service-producing sector registered its firmest performance in more than a year. However, the gain might be viewed as a continuation of an unusual bout of random volatility. The March advance followed a notable drop in February (-133,000, revised down from -92,000), which followed an upside surprise in January (160,000, revised up from 126,000).
To be sure, statistical noise has been a factor in the past three months, but the results also represent an encouraging shift in job growth from that in the second half of last year, when employment rose only marginally in the third quarter and fell in the fourth. The net change in the past three months seems to signal that job growth is not drying up. The net advance so far this year is far from brisk, but it is clearly in the plus column and noticeably better than results in late 2025.
The unemployment rate also might be viewed as favorable, as it dipped 0.1 percentage point to 4.3%, although it was a “soft” decline. That is, employment as measured by the household survey declined 64,000, but the size of the labor force fell by a larger amount (off 396,000). Still, the jobless rate has climbed only modestly higher since the labor market started to ease in 2023, and it has inched lower in the past few months.
Unemployment has been contained despite modest hiring because layoffs also have been light. Initial claims for unemployment benefits have moved sideways in the past few years, indicating no change in the pace of layoffs. This pattern is confirmed by terminations data in the report on job openings and labor turnover (JOLTs) from the Bureau of Labor Statistics.
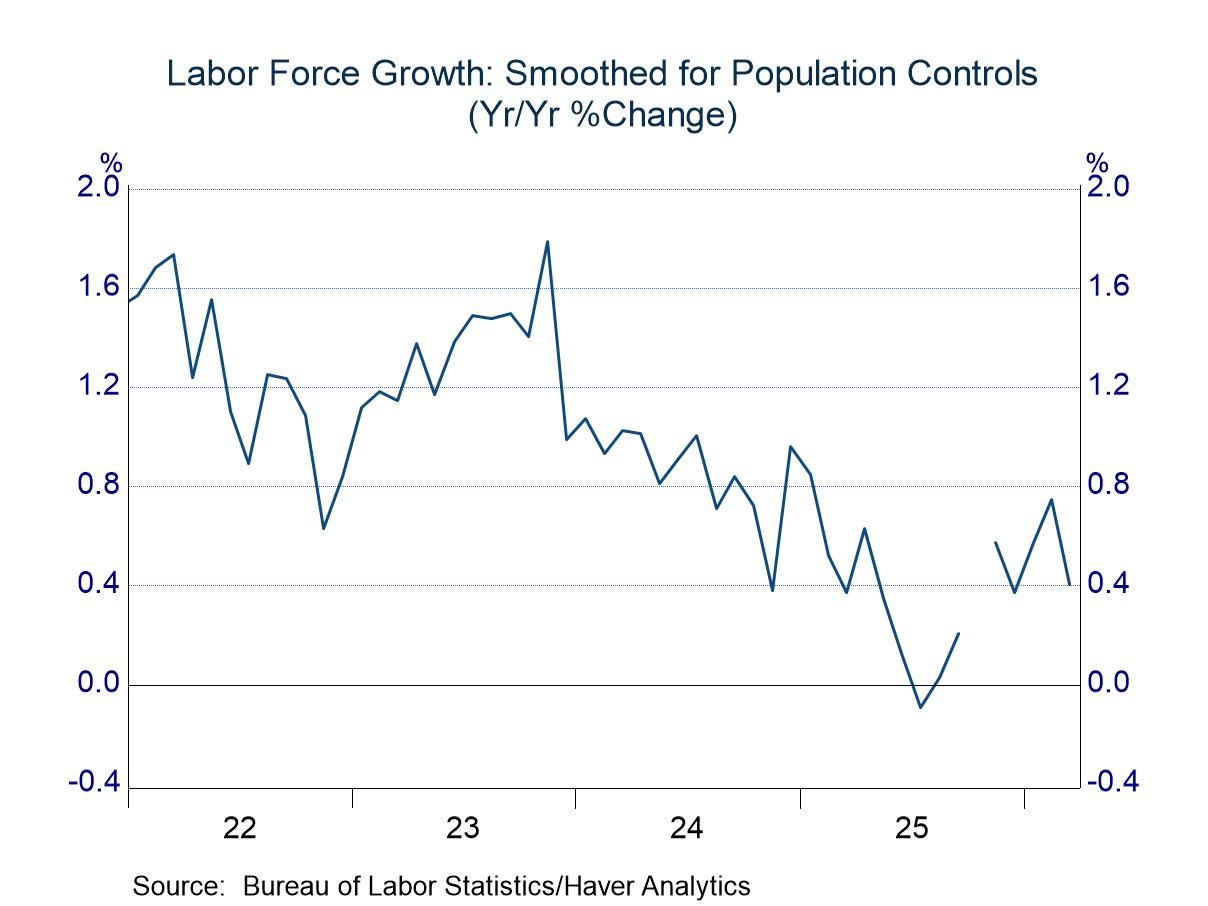
A supply-side shift in the labor market also has helped to contain the unemployment rate. Growth in the size of the labor force has slowed, and with fewer individuals seeking employment, those searching are more easily absorbed. Measures of the size of the labor force can be difficult to assess because there are breaks in the series every year. The Bureau of Labor Statistics adjusts the population controls used in its estimating procedure every January without revising past data to align with the new estimates. Thus, every January involves a discontinuity in the series, which will distort year-over-year changes.
However, Haver Analytics maintains a smoothed series originally developed by BLS to eliminate the breaks in the labor force data. As shown in the chart below, the smoothed series on the size of the labor force had been growing at a pace centered on 1.2% through 2022, but it has slowed irregularly since then (an observation for October is not available because of limited data collection during the government shutdown). The overall labor force is still growing, but the slower pace means fewer individuals looking for work, which most likely results in fewer being counted as unemployed.
The BLS collects data every month on both native-born and foreign-born individuals in the labor force. The breaks in these series are an issue, and Haver does not maintain smoothed series. However, the use of moving averages achieves enough smoothing to provide a sense of underlying changes. The native-born labor force has moved erratically in the past couple of years, but it has continued to advance. The foreign-born labor force, in contrast, seems to have peaked in mid-2025 and has generally declined since then.
The employment and earnings data are collected from surveys taken each month during the week containing the 12th day of the month. The labor market data are contained in Haver's USECON database. Detailed figures are in the EMPL and LABOR databases. The expectations figures are in the AS1REPNA database.

Michael J. Moran
AuthorMore in Author Profile »Before joining Haver Analytics in 2025, Michael J. Moran was the chief economist of Daiwa Capital Markets America Inc. He was responsible for preparing the firm’s economic forecast and interest rate outlook. He traveled frequently to visit the clients of Daiwa Capital Markets and wrote weekly economic commentary. Mr. Moran also was involved in the flux of financial markets, as he spent a portion of each day on Daiwa’s trading floor interpreting economic statistics and Federal Reserve activity for traders and salespeople. Mr. Moran is quoted frequently in the financial press, and he appears regularly on cable news shows. He also has published articles in several journals and periodicals. Before joining Daiwa Capital Markets America, Mr. Moran worked as an economist at the Federal Reserve Board in Washington, D.C. where he analyzed a broad range of issues dealing with the financial sector of the economy and regularly briefed the Board of Governors. He was on the faculty of Pennsylvania State University from 1979 to 1980 and taught on a part-time basis at George Washington University from 1980 to 1987.
Mr. Moran received his Ph.D. in economics from Pennsylvania State University in 1980 and a B.S. in business administration from the University of Bridgeport in 1975. He was a CFA charter holder from 2002 until 2016.
More Economy in Brief
 Asia
Asia

