Keep an Eye on Real Wages and Hours Worked in Economy
|in:Viewpoints
U.S. economic growth has remained solid through most of 2025, driven by healthy gains in consumption and strong business fixed investment, particularly for the buildout of AI. This has defied the pessimists’ worries about President Trump’s misguided tariffs, clampdown on immigration and cuts in research grants to universities. The only real laggard in 2025 was the housing sector, which suffered from continuous declines in construction and improvements. But that was last year and we should not expect any let up in erratic tariff policies and anti-immigrant initiatives in 2026.
Despite these obstacles, the outlook for sustained expansion in 2026 looks favorable, and the probability for recession is low. Current conditions are inconsistent with onsets of recession in the past. Consider the following two items that will support aggregate demand: 1) three Fed interest rate cuts in September-December 2025 lowered the real Fed funds rate below the Fed’s estimate of the longer-run real rate of interest consistent with its dual mandate of 2% inflation and maximum employment, and the Federal Reserve Bank of Chicago’s Financial Conditions Index signals loose financial conditions, and 2) fiscal policy is stimulative, as the OBBBA of 2025 extended the 2017 tax cuts and added some additional cuts (eliminating tax on income from tips, expensing of outlays for research and development) that will boost tax refunds in Spring 2026 by approximately 0.6% of disposable personal income. In this environment, 3) business inventories are relatively low and 4) employment is well-aligned with output (GDP). Accordingly, any slump in aggregate demand will not force businesses to cut output and/or employment in a meaningful way.
Labor market and personal income dynamics. One key trend to keep an eye on is real wage and salary incomes, a key indicator of labor market conditions and measure of consumer purchasing power. Growth in personal income from wages and salaries has decelerated to 3.8% in the year ending November 2025 (Chart 1). That’s down from a 5.5% rise in the prior year. At the same time, CPI inflation was 2.7% in the last two years ending November 2025. According, the year-over-year growth in real personal disposable income from wage and salaries has receded to 1.1% in the year ending November 2025, significantly slower than its 2.8% rise in the prior year.
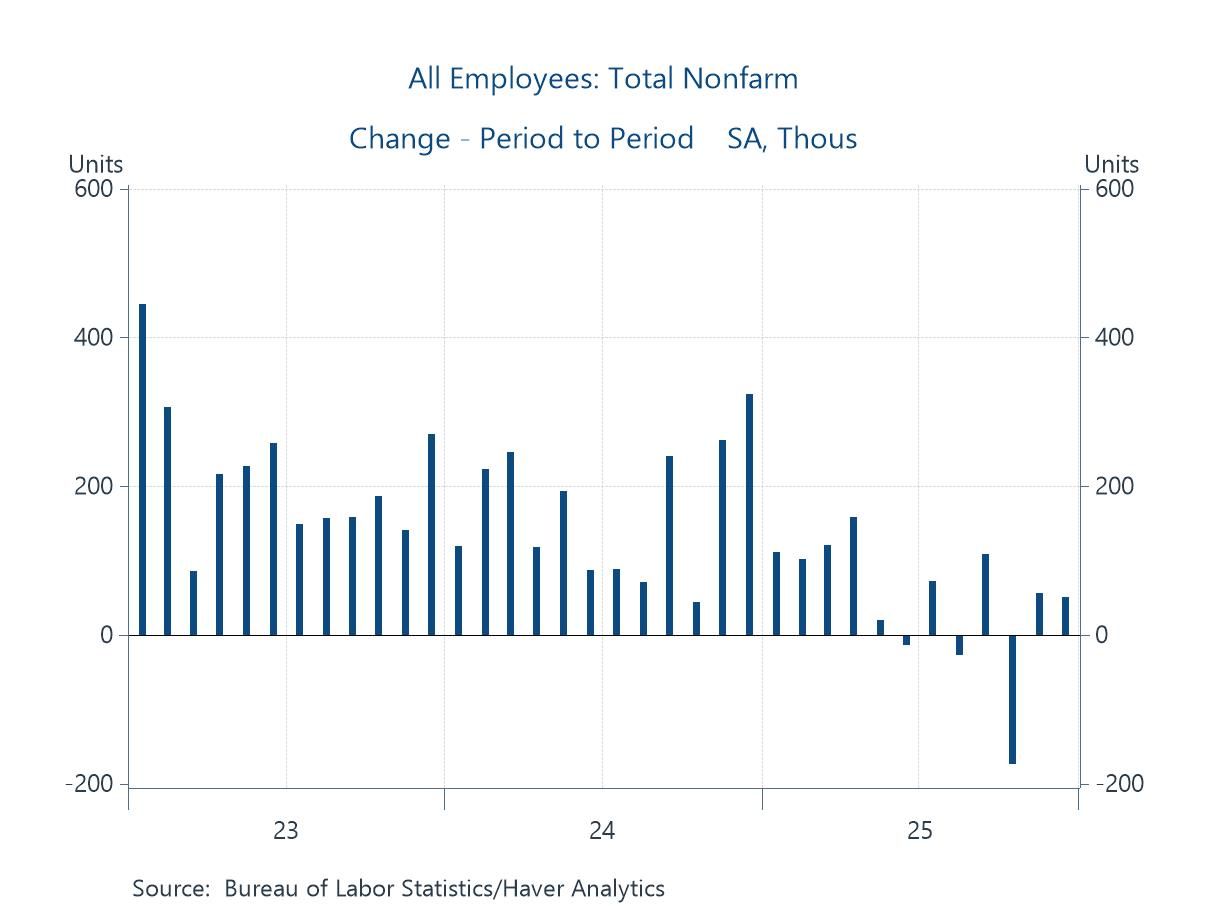
This deceleration in real wages and salaries reflects primarily a combination of moderating gains in average hourly earnings (AHE) and weakness in employment. As shown in Chart 2, AHE have moderated to 3.5% year-over-year growth from 4.1% a year earlier. The yr/yr rise in AHE will decline further in the January and February 2026 readings as the high monthly increases in Jan-Feb 2025 roll off. At the same time, establishment payroll gains have flattened significantly. In the six months July-December 2025, employment rose a net 87,000, an average of 14k per month; in the prior six months jobs rose 497k, an average monthly rise of 82k (Chart 3). In the prior year ending December 2024, employment rose over 2 million.
Chart 1. Wages and Salaries and CPI Inflation
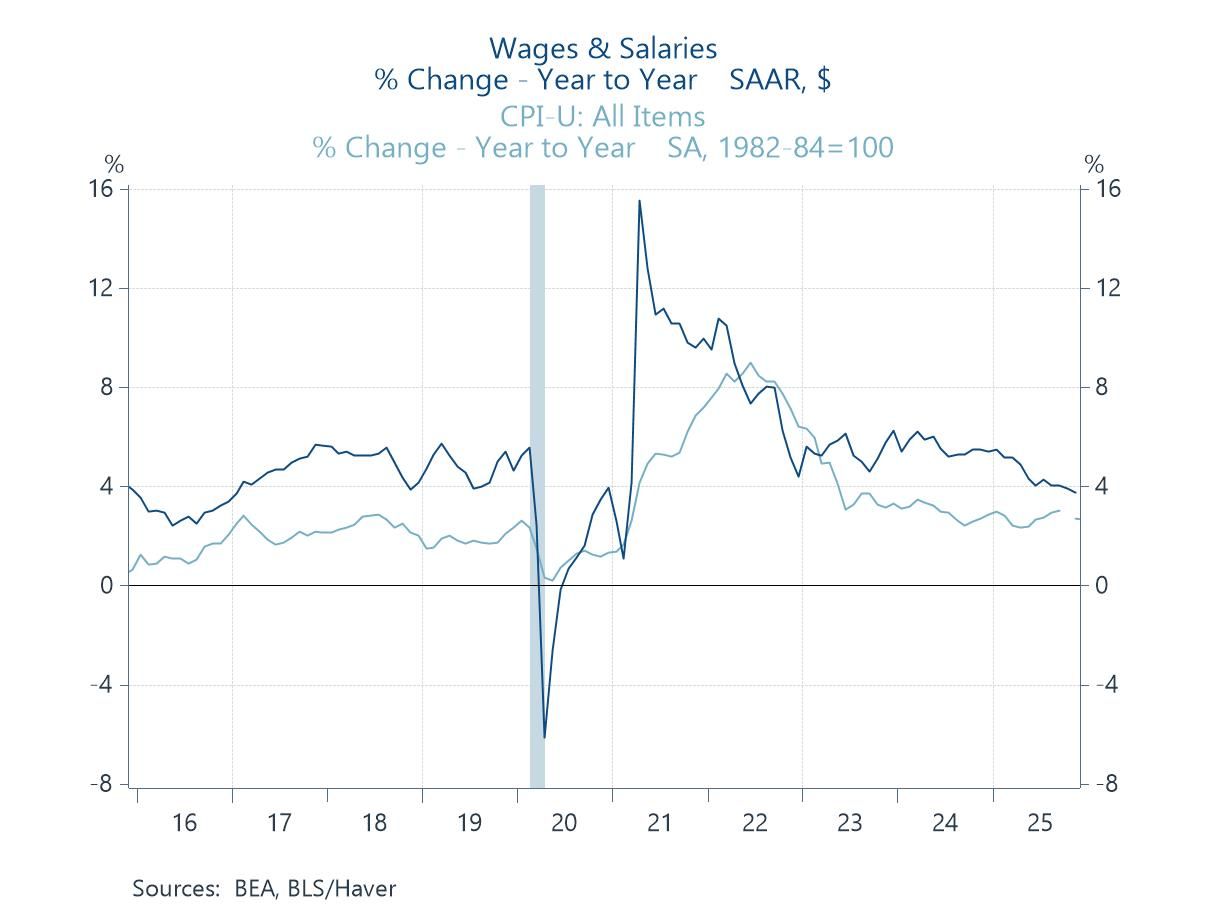
Chart 2. Average Hourly Earnings
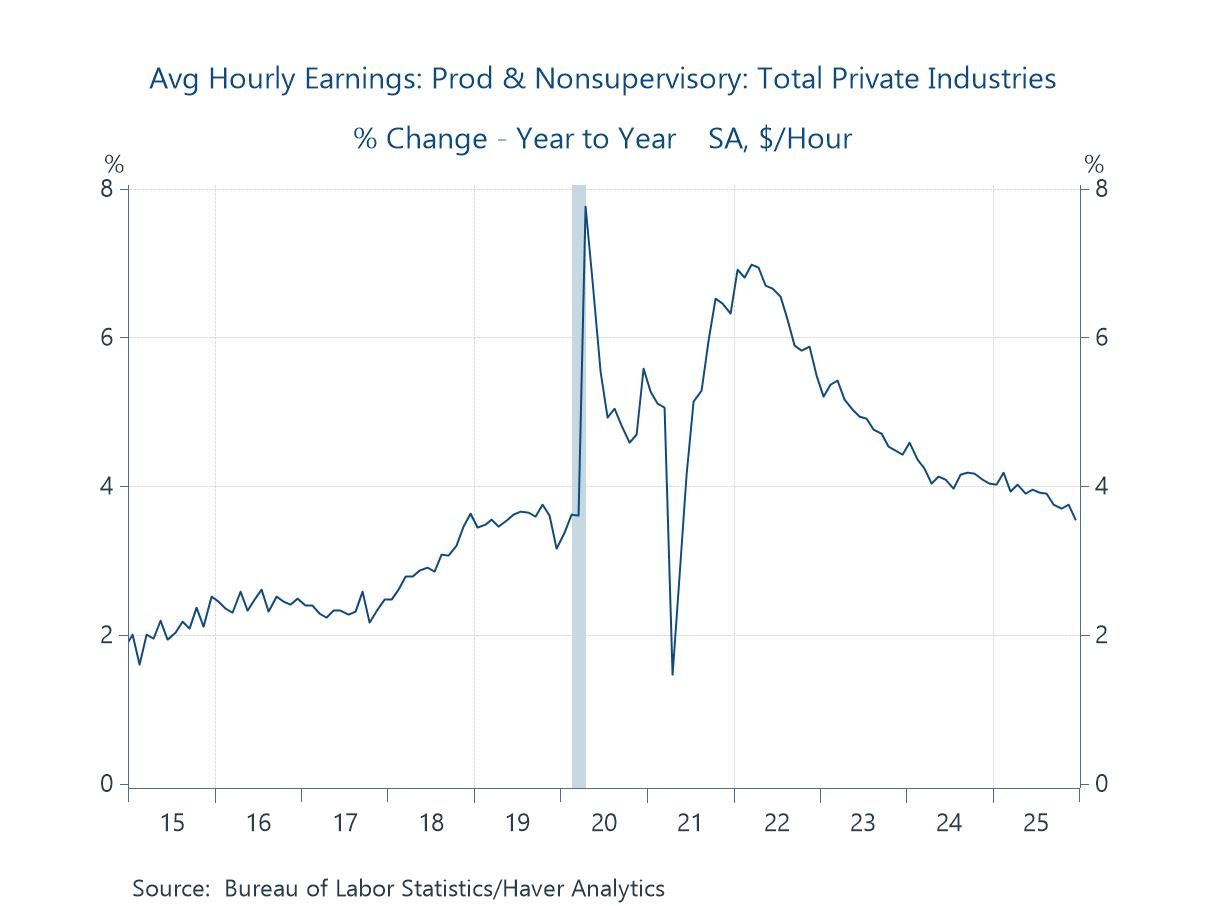
Chart 3. Establishment Payrolls
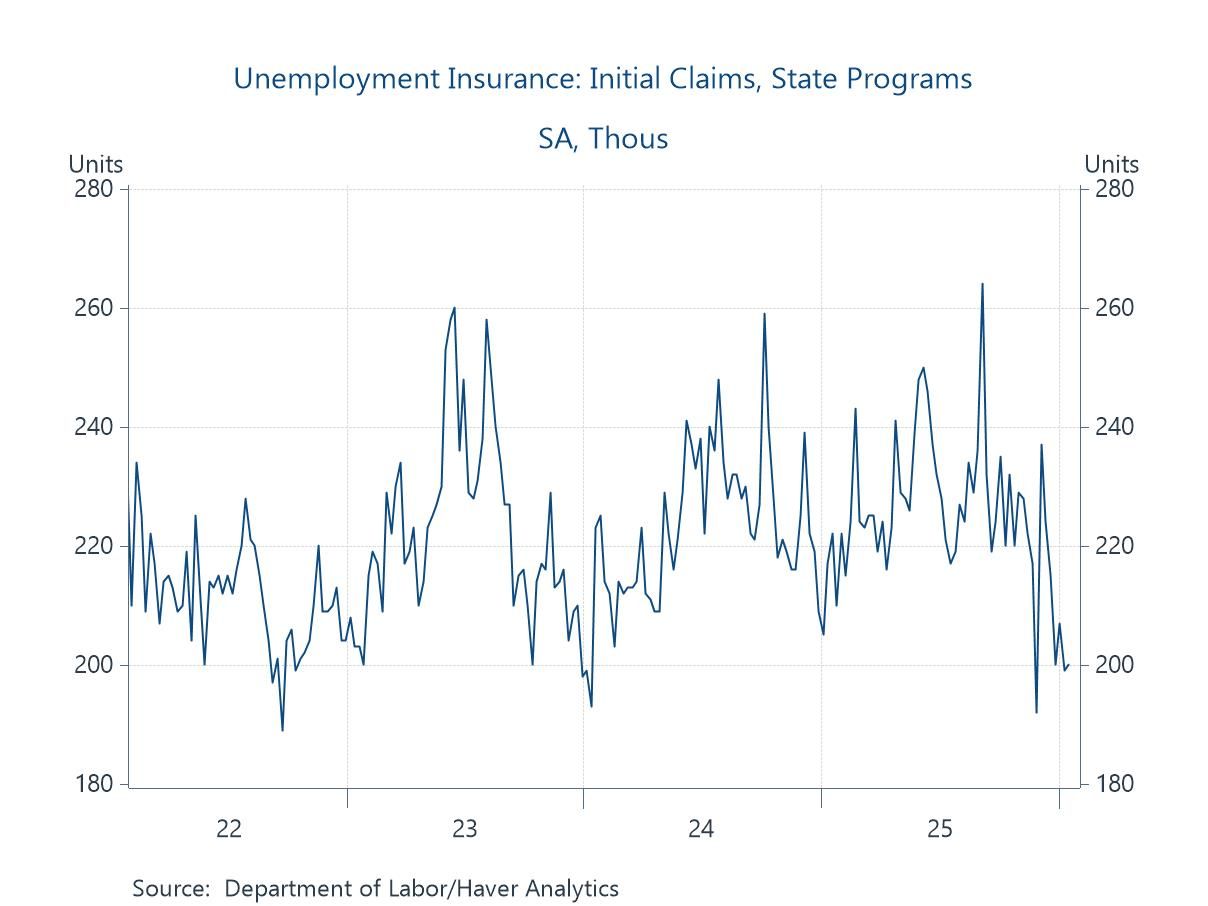
The flatter employment gains and weakening of labor markets is a product of less supply of labor and weaker demand. Trump’s clampdown on immigration has clearly constrained the supply of labor. It has probably also dampened business demand for labor, particularly in construction and leisure and hospitality sectors. Businesses have responded by slowing hiring while the high costs of search and hiring have reduced their layoffs. Initial unemployment claims have remained low (Chart 4).
Chart 4. Initial Unemployment Claims
Amid slower gains in employment and average hourly earnings, the positive in labor markets is aggregate hours worked increased 0.7% this year. That’s fortunate insofar as wages and salaries and disposable personal income are driven by hours worked, not employment. Importantly, stronger productivity gains have powered the solid economic growth. During the year ending 2025Q3, productivity (private output/aggregate hours worked) in the nonfarm business sector rose 1.9% and 2.3% in the manufacturing sectors. This decided pickup in productivity reflects the continued momentum in business investment in data storage and related AI infrastructure plus production efficiencies stemming. Implementation of AI is contributing to efficiencies in both manufacturing and service-producing industries.
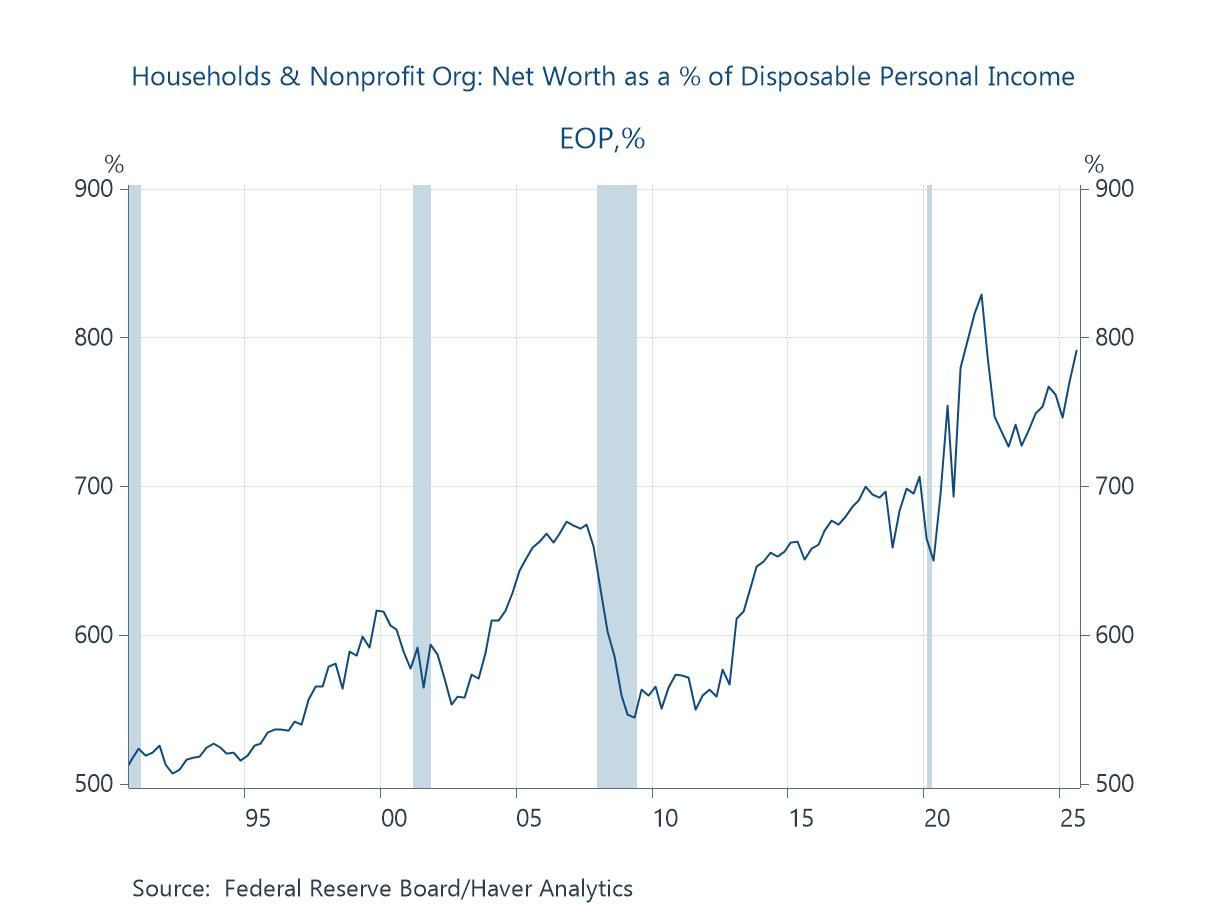
The wealth effect and rate of personal saving. Most households spend most of what they earn, so consumption will be driven largely by growth in disposable income. In addition, the ongoing surge in household net worth, reflecting the rise in equity valuations and real estate, has lifted the propensity to spend. In the last year, household net worth has risen 7.6% to an all-time high of $181 trillion. To put it into perspective, household net worth has risen to 7.9 times the annual flow of disposable personal income (Chart 5). The positive wealth effect has increased the propensity to spend out of disposable income. As a result, the rate of personal saving declined to 3.5% at its last reading in November 2025. It cannot be expected to fall much further.
Chart 5. Household Net Worth/Disposable Personal Income
Add it all up, and consumer purchasing power, driven by employment, hours worked and average hourly earnings are key variables to follow in 2026. The highest probability outlook is continued expansion at a slower pace of growth.

Mickey D. Levy
AuthorMore in Author Profile »Mickey Levy is a macroeconomist who uniquely analyzes economic and financial market performance and how they are affected by monetary and fiscal policies. Dr. Levy started his career conducting research at the Congressional Budget Office and American Enterprise Institute, and for many years was Chief Economist at Bank of America, followed by Berenberg Capital Markets. He is a Visiting Fellow at the Hoover Institution at Stanford University and a long-standing member of the Shadow Open Market Committee.
Dr. Levy is a leading expert on the Federal Reserve’s monetary policy, with a deep understanding of fiscal policy and how they interact. He has researched and spoken extensively on financial market behavior, and has a strong track record in forecasting. Dr. Levy’s early research was on the Fed’s debt monetization and different aspects of the government’s public finances. He has written hundreds of articles and papers for leading economic journals on U.S. and global economic conditions. He has testified frequently before the U.S. Congress on monetary and fiscal policies, banking and credit conditions, regulations, and global trade, and is a frequent contributor to the Wall Street Journal.
He is a member of the Council on Foreign Relations and the Economic Club of New York, and previously served on the Panel of Economic Advisors to the Federal Reserve of New York, as well as the Advisory Panel of the Office of Financial Research.
Dr. Levy holds a Ph.D. in Economics from University of Maryland, a Master’s in Public Policy from U.C. Berkeley, and a B.A. in Economics from U.C. Santa Barbara.
 Global